Portuguese vs Immigrants from Somalia High School Diploma
COMPARE
Portuguese
Immigrants from Somalia
High School Diploma
High School Diploma Comparison
Portuguese
Immigrants from Somalia
88.5%
HIGH SCHOOL DIPLOMA
14.4/ 100
METRIC RATING
208th/ 347
METRIC RANK
88.4%
HIGH SCHOOL DIPLOMA
11.3/ 100
METRIC RATING
213th/ 347
METRIC RANK
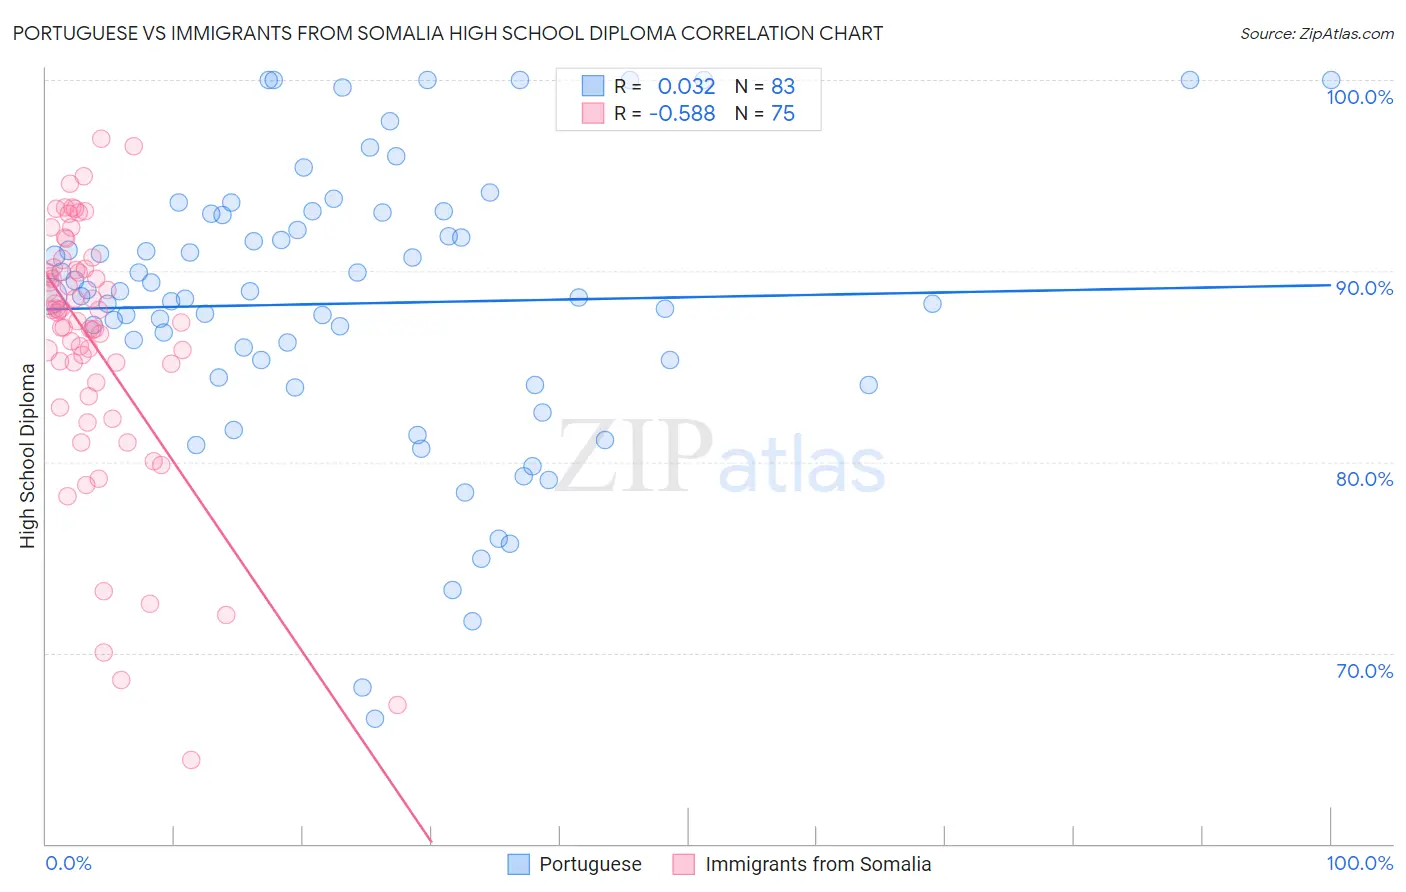
Portuguese vs Immigrants from Somalia High School Diploma Correlation Chart
The statistical analysis conducted on geographies consisting of 450,368,110 people shows no correlation between the proportion of Portuguese and percentage of population with at least high school diploma education in the United States with a correlation coefficient (R) of 0.032 and weighted average of 88.5%. Similarly, the statistical analysis conducted on geographies consisting of 92,101,093 people shows a substantial negative correlation between the proportion of Immigrants from Somalia and percentage of population with at least high school diploma education in the United States with a correlation coefficient (R) of -0.588 and weighted average of 88.4%, a difference of 0.11%.
High School Diploma Correlation Summary
| Measurement | Portuguese | Immigrants from Somalia |
| Minimum | 66.5% | 64.4% |
| Maximum | 100.0% | 96.9% |
| Range | 33.5% | 32.5% |
| Mean | 88.3% | 86.2% |
| Median | 88.7% | 87.8% |
| Interquartile 25% (IQ1) | 84.4% | 84.2% |
| Interquartile 75% (IQ3) | 93.0% | 90.1% |
| Interquartile Range (IQR) | 8.5% | 6.0% |
| Standard Deviation (Sample) | 7.4% | 6.8% |
| Standard Deviation (Population) | 7.3% | 6.7% |
Demographics Similar to Portuguese and Immigrants from Somalia by High School Diploma
In terms of high school diploma, the demographic groups most similar to Portuguese are Cherokee (88.5%, a difference of 0.0%), Samoan (88.5%, a difference of 0.010%), Immigrants from Sierra Leone (88.6%, a difference of 0.040%), Inupiat (88.5%, a difference of 0.040%), and Arapaho (88.6%, a difference of 0.050%). Similarly, the demographic groups most similar to Immigrants from Somalia are Immigrants from Cameroon (88.4%, a difference of 0.010%), Crow (88.4%, a difference of 0.020%), Chickasaw (88.4%, a difference of 0.020%), Immigrants from Africa (88.4%, a difference of 0.030%), and South American Indian (88.5%, a difference of 0.040%).
| Demographics | Rating | Rank | High School Diploma |
| Hawaiians | 18.3 /100 | #200 | Poor 88.6% |
| Koreans | 18.1 /100 | #201 | Poor 88.6% |
| Panamanians | 18.0 /100 | #202 | Poor 88.6% |
| Somalis | 17.5 /100 | #203 | Poor 88.6% |
| Armenians | 17.2 /100 | #204 | Poor 88.6% |
| Immigrants | Micronesia | 16.4 /100 | #205 | Poor 88.6% |
| Arapaho | 16.1 /100 | #206 | Poor 88.6% |
| Immigrants | Sierra Leone | 15.8 /100 | #207 | Poor 88.6% |
| Portuguese | 14.4 /100 | #208 | Poor 88.5% |
| Cherokee | 14.3 /100 | #209 | Poor 88.5% |
| Samoans | 14.0 /100 | #210 | Poor 88.5% |
| Inupiat | 13.1 /100 | #211 | Poor 88.5% |
| South American Indians | 12.2 /100 | #212 | Poor 88.5% |
| Immigrants | Somalia | 11.3 /100 | #213 | Poor 88.4% |
| Immigrants | Cameroon | 10.9 /100 | #214 | Poor 88.4% |
| Crow | 10.9 /100 | #215 | Poor 88.4% |
| Chickasaw | 10.7 /100 | #216 | Poor 88.4% |
| Immigrants | Africa | 10.6 /100 | #217 | Poor 88.4% |
| Immigrants | Bolivia | 10.3 /100 | #218 | Poor 88.4% |
| Costa Ricans | 9.6 /100 | #219 | Tragic 88.4% |
| Tongans | 9.5 /100 | #220 | Tragic 88.4% |