Fijian vs Honduran High School Diploma
COMPARE
Fijian
Honduran
High School Diploma
High School Diploma Comparison
Fijians
Hondurans
86.0%
HIGH SCHOOL DIPLOMA
0.0/ 100
METRIC RATING
290th/ 347
METRIC RANK
83.0%
HIGH SCHOOL DIPLOMA
0.0/ 100
METRIC RATING
327th/ 347
METRIC RANK
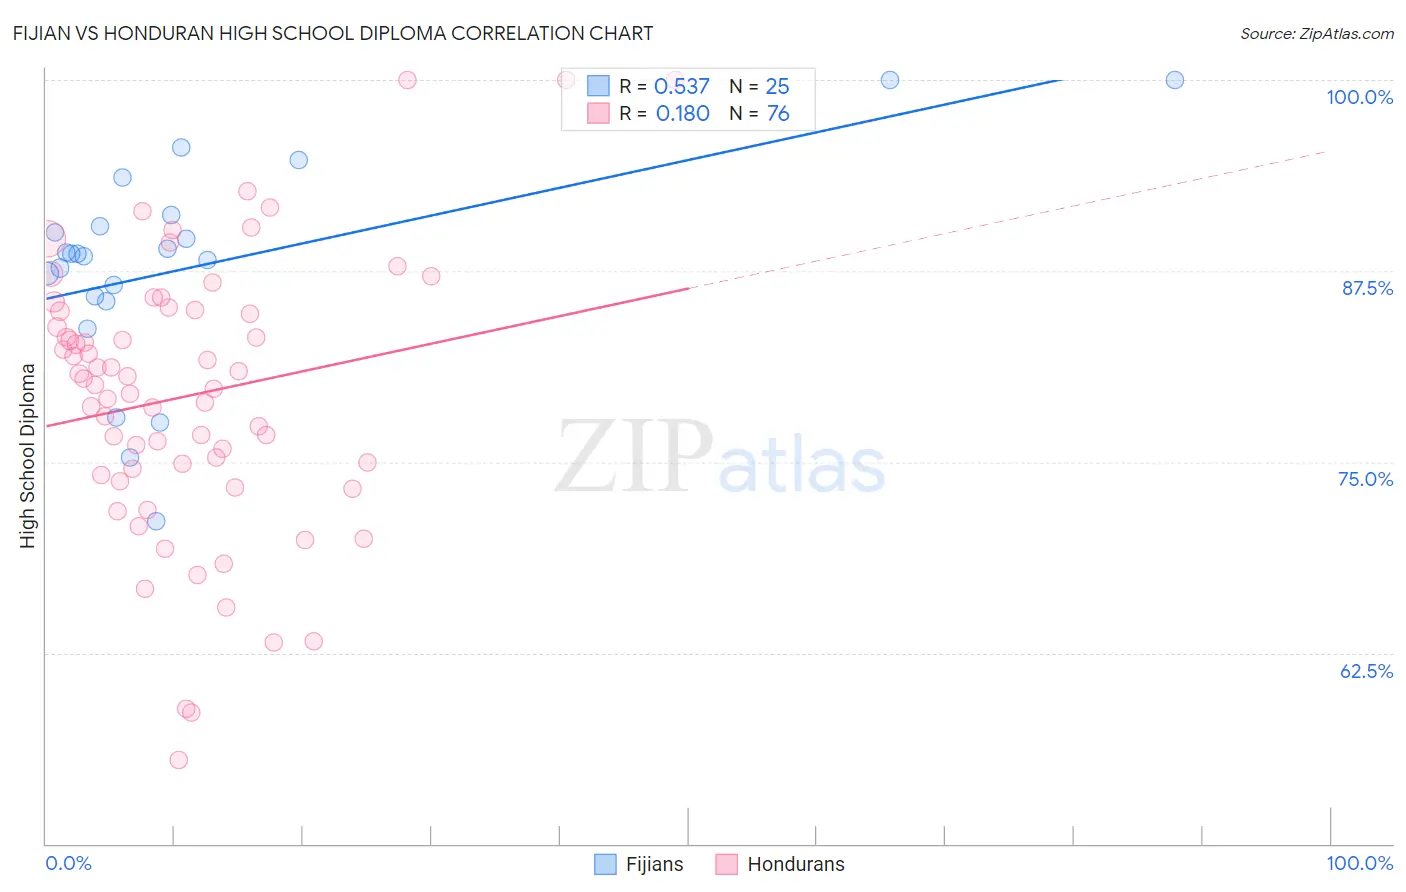
Fijian vs Honduran High School Diploma Correlation Chart
The statistical analysis conducted on geographies consisting of 55,948,842 people shows a substantial positive correlation between the proportion of Fijians and percentage of population with at least high school diploma education in the United States with a correlation coefficient (R) of 0.537 and weighted average of 86.0%. Similarly, the statistical analysis conducted on geographies consisting of 357,858,750 people shows a poor positive correlation between the proportion of Hondurans and percentage of population with at least high school diploma education in the United States with a correlation coefficient (R) of 0.180 and weighted average of 83.0%, a difference of 3.6%.
High School Diploma Correlation Summary
| Measurement | Fijian | Honduran |
| Minimum | 71.1% | 55.5% |
| Maximum | 100.0% | 100.0% |
| Range | 28.9% | 44.5% |
| Mean | 87.8% | 79.3% |
| Median | 88.6% | 80.2% |
| Interquartile 25% (IQ1) | 85.7% | 74.3% |
| Interquartile 75% (IQ3) | 90.8% | 84.9% |
| Interquartile Range (IQR) | 5.1% | 10.6% |
| Standard Deviation (Sample) | 6.9% | 9.0% |
| Standard Deviation (Population) | 6.7% | 9.0% |
Similar Demographics by High School Diploma
Demographics Similar to Fijians by High School Diploma
In terms of high school diploma, the demographic groups most similar to Fijians are Yup'ik (86.1%, a difference of 0.070%), Haitian (85.9%, a difference of 0.13%), Japanese (85.9%, a difference of 0.14%), British West Indian (85.9%, a difference of 0.16%), and Ute (86.2%, a difference of 0.18%).
| Demographics | Rating | Rank | High School Diploma |
| Immigrants | Barbados | 0.0 /100 | #283 | Tragic 86.4% |
| Paiute | 0.0 /100 | #284 | Tragic 86.4% |
| Immigrants | West Indies | 0.0 /100 | #285 | Tragic 86.2% |
| Immigrants | St. Vincent and the Grenadines | 0.0 /100 | #286 | Tragic 86.2% |
| Ute | 0.0 /100 | #287 | Tragic 86.2% |
| Immigrants | Vietnam | 0.0 /100 | #288 | Tragic 86.2% |
| Yup'ik | 0.0 /100 | #289 | Tragic 86.1% |
| Fijians | 0.0 /100 | #290 | Tragic 86.0% |
| Haitians | 0.0 /100 | #291 | Tragic 85.9% |
| Japanese | 0.0 /100 | #292 | Tragic 85.9% |
| British West Indians | 0.0 /100 | #293 | Tragic 85.9% |
| Immigrants | Fiji | 0.0 /100 | #294 | Tragic 85.8% |
| Immigrants | Immigrants | 0.0 /100 | #295 | Tragic 85.8% |
| Immigrants | Cambodia | 0.0 /100 | #296 | Tragic 85.6% |
| Immigrants | Grenada | 0.0 /100 | #297 | Tragic 85.6% |
Demographics Similar to Hondurans by High School Diploma
In terms of high school diploma, the demographic groups most similar to Hondurans are Mexican American Indian (83.0%, a difference of 0.040%), Dominican (82.9%, a difference of 0.050%), Immigrants from Nicaragua (83.1%, a difference of 0.11%), Hispanic or Latino (82.9%, a difference of 0.14%), and Immigrants from the Azores (82.8%, a difference of 0.22%).
| Demographics | Rating | Rank | High School Diploma |
| Nicaraguans | 0.0 /100 | #320 | Tragic 84.1% |
| Yuman | 0.0 /100 | #321 | Tragic 84.0% |
| Lumbee | 0.0 /100 | #322 | Tragic 83.6% |
| Immigrants | Cuba | 0.0 /100 | #323 | Tragic 83.5% |
| Immigrants | Cabo Verde | 0.0 /100 | #324 | Tragic 83.3% |
| Immigrants | Nicaragua | 0.0 /100 | #325 | Tragic 83.1% |
| Mexican American Indians | 0.0 /100 | #326 | Tragic 83.0% |
| Hondurans | 0.0 /100 | #327 | Tragic 83.0% |
| Dominicans | 0.0 /100 | #328 | Tragic 82.9% |
| Hispanics or Latinos | 0.0 /100 | #329 | Tragic 82.9% |
| Immigrants | Azores | 0.0 /100 | #330 | Tragic 82.8% |
| Central Americans | 0.0 /100 | #331 | Tragic 82.5% |
| Immigrants | Honduras | 0.0 /100 | #332 | Tragic 82.5% |
| Immigrants | Latin America | 0.0 /100 | #333 | Tragic 82.1% |
| Tohono O'odham | 0.0 /100 | #334 | Tragic 82.1% |