Immigrants from Ghana vs Immigrants from Indonesia Master's Degree
COMPARE
Immigrants from Ghana
Immigrants from Indonesia
Master's Degree
Master's Degree Comparison
Immigrants from Ghana
Immigrants from Indonesia
15.0%
MASTER'S DEGREE
53.6/ 100
METRIC RATING
171st/ 347
METRIC RANK
17.6%
MASTER'S DEGREE
99.6/ 100
METRIC RATING
76th/ 347
METRIC RANK
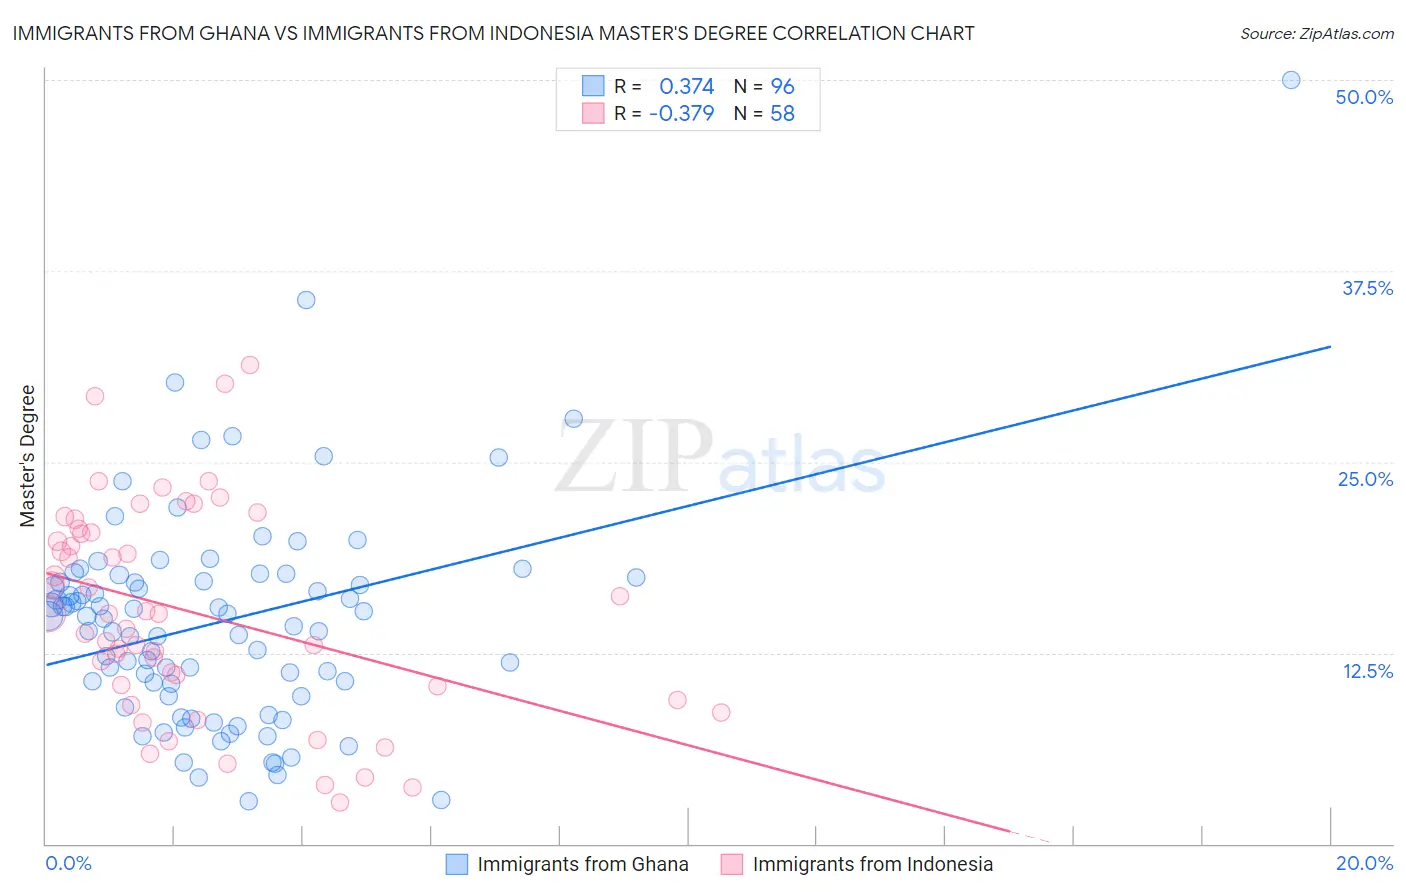
Immigrants from Ghana vs Immigrants from Indonesia Master's Degree Correlation Chart
The statistical analysis conducted on geographies consisting of 199,892,206 people shows a mild positive correlation between the proportion of Immigrants from Ghana and percentage of population with at least master's degree education in the United States with a correlation coefficient (R) of 0.374 and weighted average of 15.0%. Similarly, the statistical analysis conducted on geographies consisting of 215,754,455 people shows a mild negative correlation between the proportion of Immigrants from Indonesia and percentage of population with at least master's degree education in the United States with a correlation coefficient (R) of -0.379 and weighted average of 17.6%, a difference of 17.4%.
Master's Degree Correlation Summary
| Measurement | Immigrants from Ghana | Immigrants from Indonesia |
| Minimum | 2.8% | 2.7% |
| Maximum | 50.0% | 31.4% |
| Range | 47.2% | 28.7% |
| Mean | 14.5% | 15.2% |
| Median | 14.8% | 15.0% |
| Interquartile 25% (IQ1) | 10.1% | 10.3% |
| Interquartile 75% (IQ3) | 17.3% | 20.4% |
| Interquartile Range (IQR) | 7.2% | 10.0% |
| Standard Deviation (Sample) | 7.1% | 6.9% |
| Standard Deviation (Population) | 7.1% | 6.8% |
Similar Demographics by Master's Degree
Demographics Similar to Immigrants from Ghana by Master's Degree
In terms of master's degree, the demographic groups most similar to Immigrants from Ghana are Immigrants from Uruguay (15.0%, a difference of 0.10%), Costa Rican (15.0%, a difference of 0.14%), Irish (15.0%, a difference of 0.35%), Slovak (14.9%, a difference of 0.46%), and Immigrants from Peru (14.9%, a difference of 0.51%).
| Demographics | Rating | Rank | Master's Degree |
| Colombians | 66.9 /100 | #164 | Good 15.3% |
| Immigrants | Kenya | 66.6 /100 | #165 | Good 15.3% |
| Swedes | 66.1 /100 | #166 | Good 15.2% |
| Senegalese | 65.6 /100 | #167 | Good 15.2% |
| Immigrants | North Macedonia | 64.5 /100 | #168 | Good 15.2% |
| Scottish | 62.7 /100 | #169 | Good 15.2% |
| Irish | 56.3 /100 | #170 | Average 15.0% |
| Immigrants | Ghana | 53.6 /100 | #171 | Average 15.0% |
| Immigrants | Uruguay | 52.8 /100 | #172 | Average 15.0% |
| Costa Ricans | 52.5 /100 | #173 | Average 15.0% |
| Slovaks | 50.0 /100 | #174 | Average 14.9% |
| Immigrants | Peru | 49.6 /100 | #175 | Average 14.9% |
| Nigerians | 48.6 /100 | #176 | Average 14.9% |
| Immigrants | Colombia | 48.3 /100 | #177 | Average 14.9% |
| English | 45.0 /100 | #178 | Average 14.8% |
Demographics Similar to Immigrants from Indonesia by Master's Degree
In terms of master's degree, the demographic groups most similar to Immigrants from Indonesia are Egyptian (17.6%, a difference of 0.030%), Immigrants from Eastern Europe (17.6%, a difference of 0.12%), Immigrants from Hungary (17.5%, a difference of 0.31%), Immigrants from Romania (17.7%, a difference of 0.40%), and Immigrants from Lebanon (17.5%, a difference of 0.45%).
| Demographics | Rating | Rank | Master's Degree |
| Immigrants | Uzbekistan | 99.8 /100 | #69 | Exceptional 17.9% |
| Immigrants | Western Europe | 99.8 /100 | #70 | Exceptional 17.8% |
| Immigrants | Pakistan | 99.7 /100 | #71 | Exceptional 17.8% |
| Lithuanians | 99.7 /100 | #72 | Exceptional 17.7% |
| Zimbabweans | 99.7 /100 | #73 | Exceptional 17.7% |
| Immigrants | Romania | 99.7 /100 | #74 | Exceptional 17.7% |
| Egyptians | 99.6 /100 | #75 | Exceptional 17.6% |
| Immigrants | Indonesia | 99.6 /100 | #76 | Exceptional 17.6% |
| Immigrants | Eastern Europe | 99.6 /100 | #77 | Exceptional 17.6% |
| Immigrants | Hungary | 99.6 /100 | #78 | Exceptional 17.5% |
| Immigrants | Lebanon | 99.6 /100 | #79 | Exceptional 17.5% |
| Carpatho Rusyns | 99.6 /100 | #80 | Exceptional 17.5% |
| Immigrants | Western Asia | 99.5 /100 | #81 | Exceptional 17.5% |
| Greeks | 99.5 /100 | #82 | Exceptional 17.5% |
| Immigrants | Zimbabwe | 99.5 /100 | #83 | Exceptional 17.4% |