Panamanian vs Taiwanese Master's Degree
COMPARE
Panamanian
Taiwanese
Master's Degree
Master's Degree Comparison
Panamanians
Taiwanese
14.4%
MASTER'S DEGREE
25.1/ 100
METRIC RATING
200th/ 347
METRIC RANK
16.1%
MASTER'S DEGREE
91.9/ 100
METRIC RATING
131st/ 347
METRIC RANK
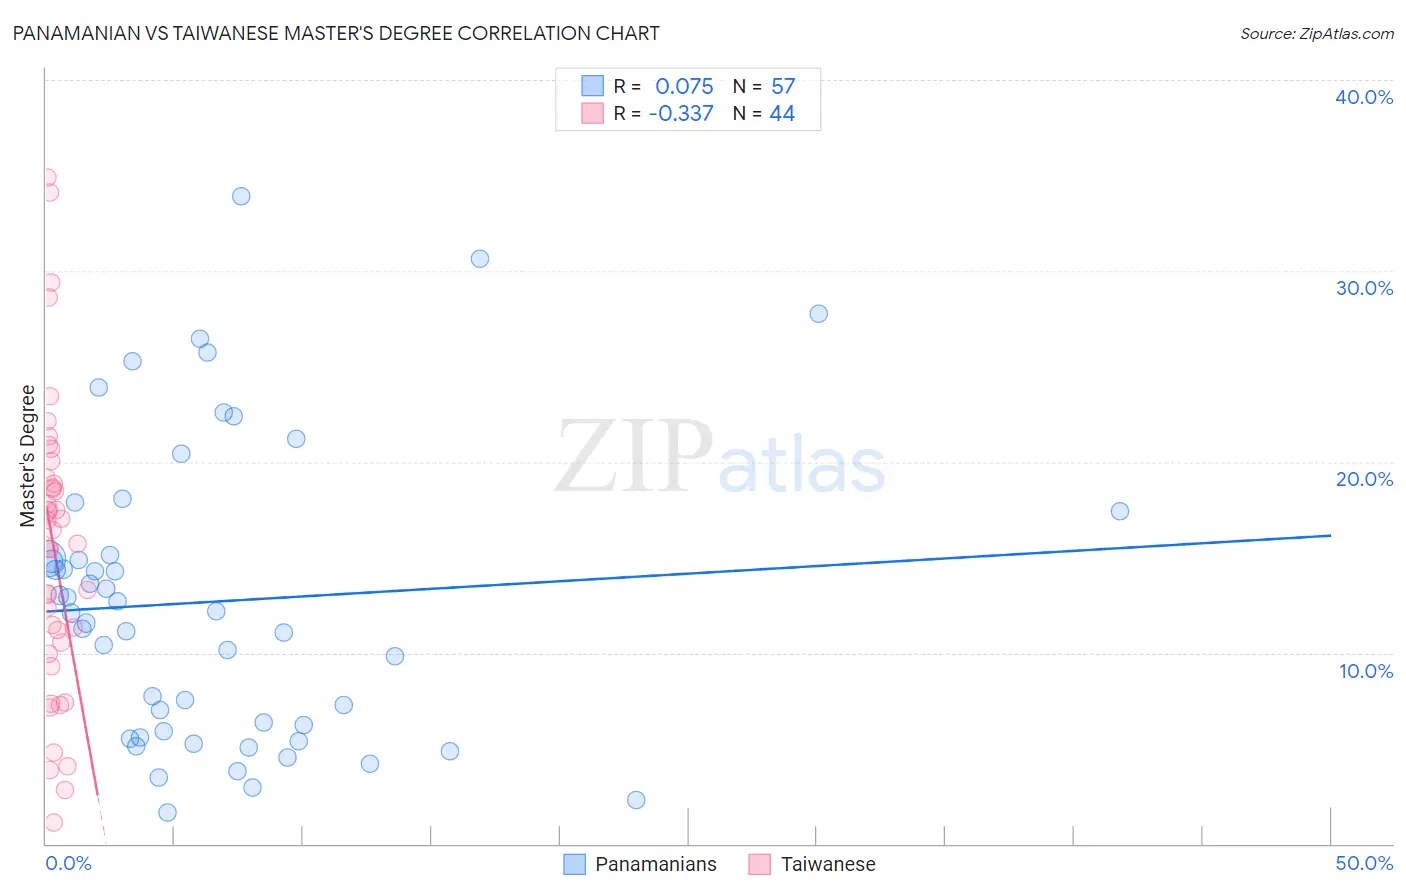
Panamanian vs Taiwanese Master's Degree Correlation Chart
The statistical analysis conducted on geographies consisting of 281,151,832 people shows a slight positive correlation between the proportion of Panamanians and percentage of population with at least master's degree education in the United States with a correlation coefficient (R) of 0.075 and weighted average of 14.4%. Similarly, the statistical analysis conducted on geographies consisting of 31,724,936 people shows a mild negative correlation between the proportion of Taiwanese and percentage of population with at least master's degree education in the United States with a correlation coefficient (R) of -0.337 and weighted average of 16.1%, a difference of 11.7%.
Master's Degree Correlation Summary
| Measurement | Panamanian | Taiwanese |
| Minimum | 1.6% | 1.1% |
| Maximum | 33.9% | 34.9% |
| Range | 32.3% | 33.8% |
| Mean | 12.7% | 15.4% |
| Median | 12.1% | 16.1% |
| Interquartile 25% (IQ1) | 5.7% | 10.2% |
| Interquartile 75% (IQ3) | 16.3% | 19.0% |
| Interquartile Range (IQR) | 10.5% | 8.8% |
| Standard Deviation (Sample) | 7.8% | 7.7% |
| Standard Deviation (Population) | 7.7% | 7.6% |
Similar Demographics by Master's Degree
Demographics Similar to Panamanians by Master's Degree
In terms of master's degree, the demographic groups most similar to Panamanians are Scotch-Irish (14.4%, a difference of 0.010%), Immigrants from Western Africa (14.4%, a difference of 0.020%), Yugoslavian (14.4%, a difference of 0.13%), French (14.4%, a difference of 0.25%), and Trinidadian and Tobagonian (14.4%, a difference of 0.28%).
| Demographics | Rating | Rank | Master's Degree |
| Immigrants | Nigeria | 32.7 /100 | #193 | Fair 14.6% |
| Chinese | 32.5 /100 | #194 | Fair 14.6% |
| Danes | 31.3 /100 | #195 | Fair 14.5% |
| Czechoslovakians | 29.9 /100 | #196 | Fair 14.5% |
| Belgians | 28.0 /100 | #197 | Fair 14.5% |
| West Indians | 27.4 /100 | #198 | Fair 14.5% |
| Immigrants | Armenia | 27.2 /100 | #199 | Fair 14.5% |
| Panamanians | 25.1 /100 | #200 | Fair 14.4% |
| Scotch-Irish | 25.0 /100 | #201 | Fair 14.4% |
| Immigrants | Western Africa | 24.9 /100 | #202 | Fair 14.4% |
| Yugoslavians | 24.3 /100 | #203 | Fair 14.4% |
| French | 23.7 /100 | #204 | Fair 14.4% |
| Trinidadians and Tobagonians | 23.5 /100 | #205 | Fair 14.4% |
| Scandinavians | 23.3 /100 | #206 | Fair 14.4% |
| Immigrants | Bosnia and Herzegovina | 22.0 /100 | #207 | Fair 14.3% |
Demographics Similar to Taiwanese by Master's Degree
In terms of master's degree, the demographic groups most similar to Taiwanese are Serbian (16.1%, a difference of 0.090%), Immigrants from Jordan (16.1%, a difference of 0.32%), Immigrants from Syria (16.2%, a difference of 0.58%), Immigrants from Sudan (16.0%, a difference of 0.63%), and Venezuelan (15.9%, a difference of 1.2%).
| Demographics | Rating | Rank | Master's Degree |
| Immigrants | Eritrea | 95.5 /100 | #124 | Exceptional 16.4% |
| Italians | 95.4 /100 | #125 | Exceptional 16.4% |
| Immigrants | Eastern Africa | 95.2 /100 | #126 | Exceptional 16.3% |
| Palestinians | 94.8 /100 | #127 | Exceptional 16.3% |
| Immigrants | Sierra Leone | 94.7 /100 | #128 | Exceptional 16.3% |
| Immigrants | Syria | 93.3 /100 | #129 | Exceptional 16.2% |
| Immigrants | Jordan | 92.7 /100 | #130 | Exceptional 16.1% |
| Taiwanese | 91.9 /100 | #131 | Exceptional 16.1% |
| Serbians | 91.7 /100 | #132 | Exceptional 16.1% |
| Immigrants | Sudan | 90.2 /100 | #133 | Exceptional 16.0% |
| Venezuelans | 88.4 /100 | #134 | Excellent 15.9% |
| South American Indians | 88.4 /100 | #135 | Excellent 15.9% |
| Assyrians/Chaldeans/Syriacs | 86.8 /100 | #136 | Excellent 15.8% |
| Europeans | 86.4 /100 | #137 | Excellent 15.8% |
| Pakistanis | 86.1 /100 | #138 | Excellent 15.8% |