Panamanian vs Immigrants from Bahamas Master's Degree
COMPARE
Panamanian
Immigrants from Bahamas
Master's Degree
Master's Degree Comparison
Panamanians
Immigrants from Bahamas
14.4%
MASTER'S DEGREE
25.1/ 100
METRIC RATING
200th/ 347
METRIC RANK
12.9%
MASTER'S DEGREE
1.4/ 100
METRIC RATING
245th/ 347
METRIC RANK
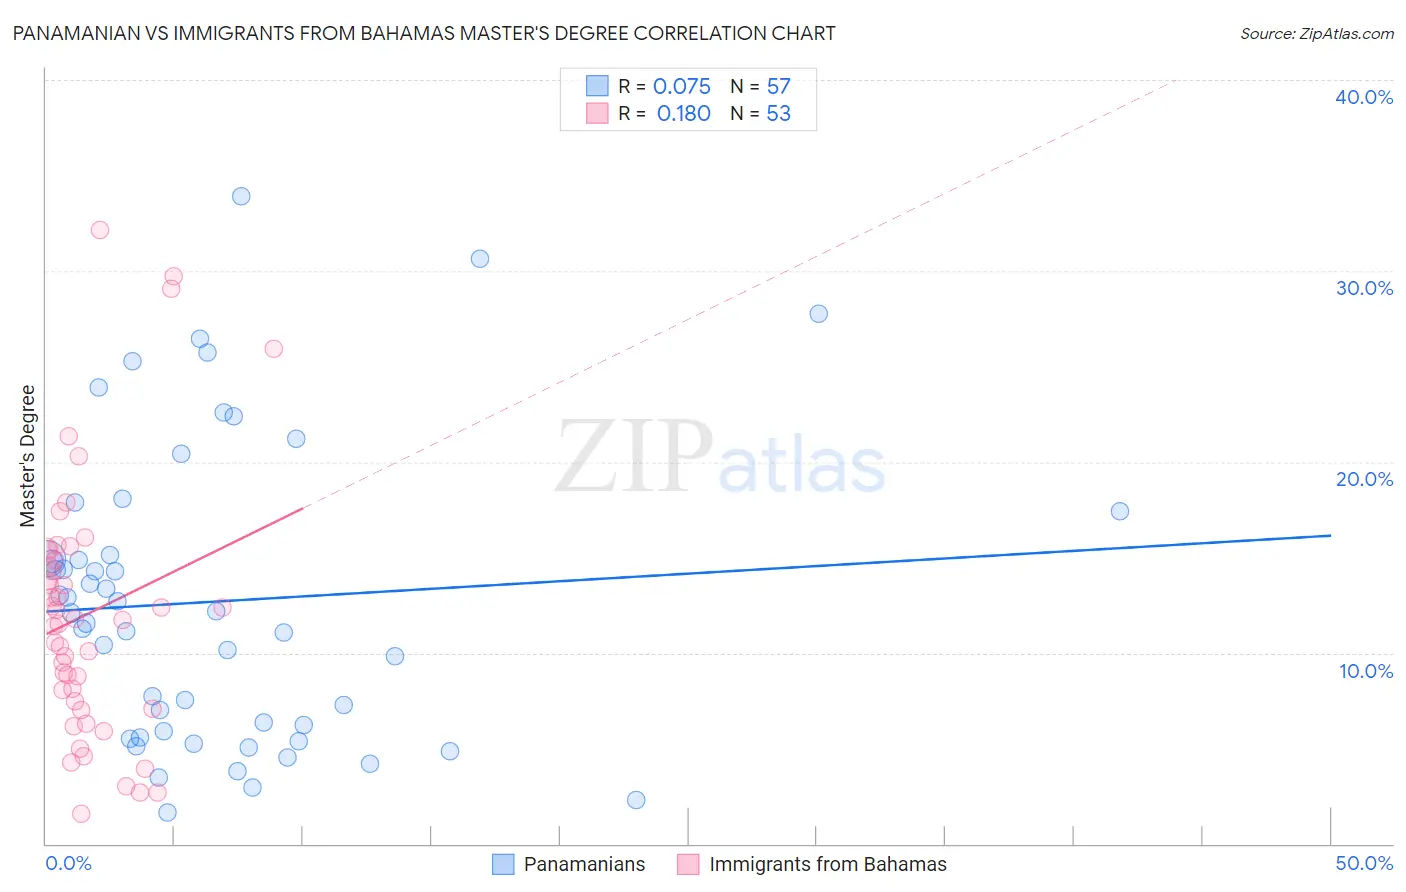
Panamanian vs Immigrants from Bahamas Master's Degree Correlation Chart
The statistical analysis conducted on geographies consisting of 281,151,832 people shows a slight positive correlation between the proportion of Panamanians and percentage of population with at least master's degree education in the United States with a correlation coefficient (R) of 0.075 and weighted average of 14.4%. Similarly, the statistical analysis conducted on geographies consisting of 104,646,319 people shows a poor positive correlation between the proportion of Immigrants from Bahamas and percentage of population with at least master's degree education in the United States with a correlation coefficient (R) of 0.180 and weighted average of 12.9%, a difference of 11.6%.
Master's Degree Correlation Summary
| Measurement | Panamanian | Immigrants from Bahamas |
| Minimum | 1.6% | 1.6% |
| Maximum | 33.9% | 32.1% |
| Range | 32.3% | 30.6% |
| Mean | 12.7% | 12.0% |
| Median | 12.1% | 11.7% |
| Interquartile 25% (IQ1) | 5.7% | 7.3% |
| Interquartile 75% (IQ3) | 16.3% | 15.1% |
| Interquartile Range (IQR) | 10.5% | 7.9% |
| Standard Deviation (Sample) | 7.8% | 6.7% |
| Standard Deviation (Population) | 7.7% | 6.7% |
Similar Demographics by Master's Degree
Demographics Similar to Panamanians by Master's Degree
In terms of master's degree, the demographic groups most similar to Panamanians are Scotch-Irish (14.4%, a difference of 0.010%), Immigrants from Western Africa (14.4%, a difference of 0.020%), Yugoslavian (14.4%, a difference of 0.13%), French (14.4%, a difference of 0.25%), and Trinidadian and Tobagonian (14.4%, a difference of 0.28%).
| Demographics | Rating | Rank | Master's Degree |
| Immigrants | Nigeria | 32.7 /100 | #193 | Fair 14.6% |
| Chinese | 32.5 /100 | #194 | Fair 14.6% |
| Danes | 31.3 /100 | #195 | Fair 14.5% |
| Czechoslovakians | 29.9 /100 | #196 | Fair 14.5% |
| Belgians | 28.0 /100 | #197 | Fair 14.5% |
| West Indians | 27.4 /100 | #198 | Fair 14.5% |
| Immigrants | Armenia | 27.2 /100 | #199 | Fair 14.5% |
| Panamanians | 25.1 /100 | #200 | Fair 14.4% |
| Scotch-Irish | 25.0 /100 | #201 | Fair 14.4% |
| Immigrants | Western Africa | 24.9 /100 | #202 | Fair 14.4% |
| Yugoslavians | 24.3 /100 | #203 | Fair 14.4% |
| French | 23.7 /100 | #204 | Fair 14.4% |
| Trinidadians and Tobagonians | 23.5 /100 | #205 | Fair 14.4% |
| Scandinavians | 23.3 /100 | #206 | Fair 14.4% |
| Immigrants | Bosnia and Herzegovina | 22.0 /100 | #207 | Fair 14.3% |
Demographics Similar to Immigrants from Bahamas by Master's Degree
In terms of master's degree, the demographic groups most similar to Immigrants from Bahamas are Immigrants from Cambodia (12.9%, a difference of 0.040%), Iroquois (12.9%, a difference of 0.070%), African (12.9%, a difference of 0.16%), Cree (12.8%, a difference of 0.47%), and Liberian (12.8%, a difference of 0.47%).
| Demographics | Rating | Rank | Master's Degree |
| Hmong | 4.0 /100 | #238 | Tragic 13.4% |
| Immigrants | Nonimmigrants | 3.4 /100 | #239 | Tragic 13.3% |
| Guamanians/Chamorros | 2.2 /100 | #240 | Tragic 13.1% |
| U.S. Virgin Islanders | 2.1 /100 | #241 | Tragic 13.1% |
| Spanish Americans | 1.9 /100 | #242 | Tragic 13.0% |
| Immigrants | Jamaica | 1.9 /100 | #243 | Tragic 13.0% |
| Delaware | 1.7 /100 | #244 | Tragic 13.0% |
| Immigrants | Bahamas | 1.4 /100 | #245 | Tragic 12.9% |
| Immigrants | Cambodia | 1.4 /100 | #246 | Tragic 12.9% |
| Iroquois | 1.4 /100 | #247 | Tragic 12.9% |
| Africans | 1.4 /100 | #248 | Tragic 12.9% |
| Cree | 1.3 /100 | #249 | Tragic 12.8% |
| Liberians | 1.3 /100 | #250 | Tragic 12.8% |
| Tlingit-Haida | 1.3 /100 | #251 | Tragic 12.8% |
| French American Indians | 1.0 /100 | #252 | Tragic 12.7% |