Immigrants from El Salvador vs Taiwanese Master's Degree
COMPARE
Immigrants from El Salvador
Taiwanese
Master's Degree
Master's Degree Comparison
Immigrants from El Salvador
Taiwanese
12.0%
MASTER'S DEGREE
0.2/ 100
METRIC RATING
282nd/ 347
METRIC RANK
16.1%
MASTER'S DEGREE
91.9/ 100
METRIC RATING
131st/ 347
METRIC RANK
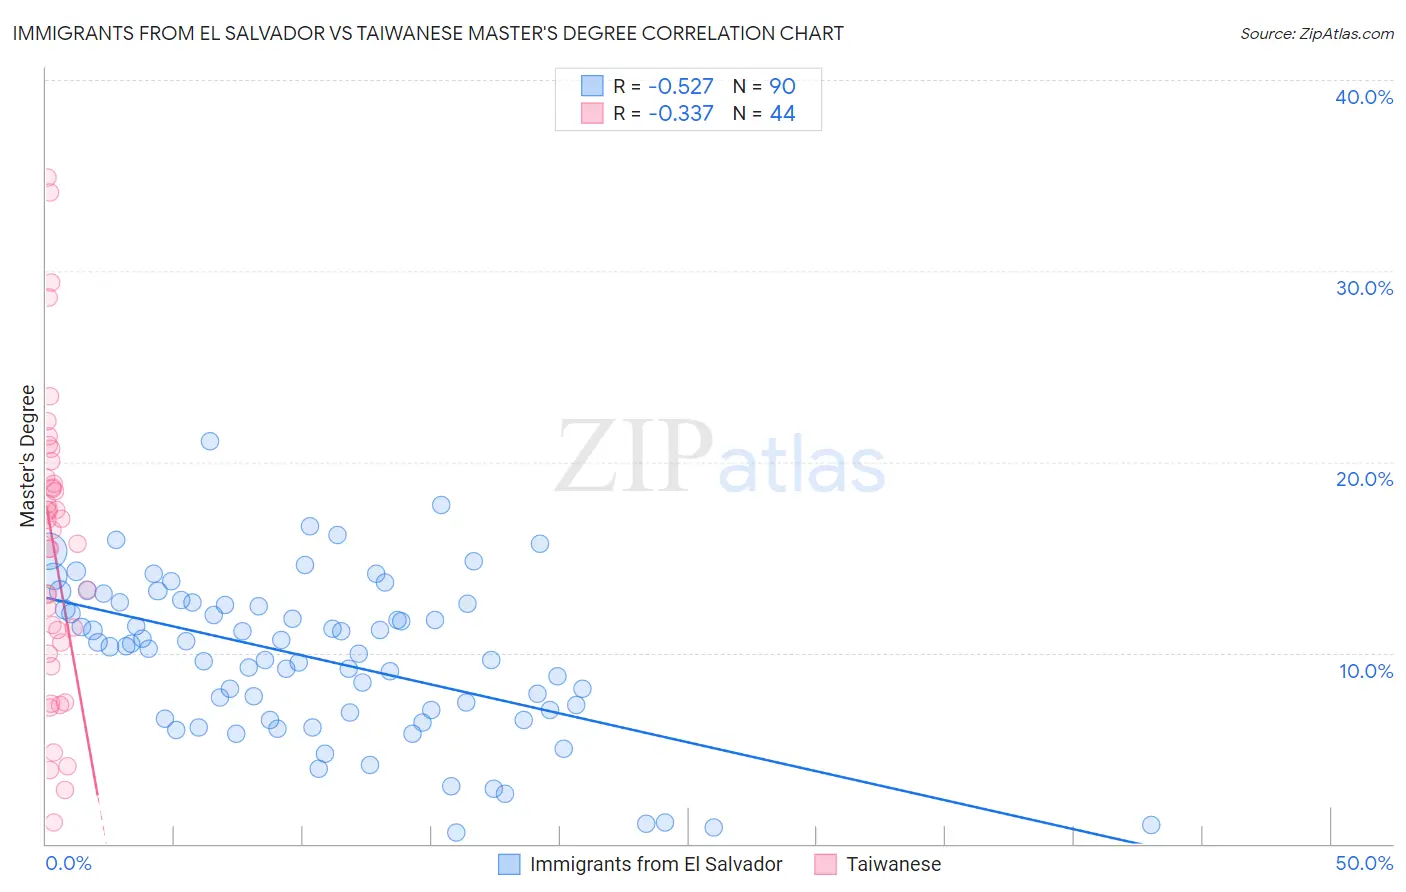
Immigrants from El Salvador vs Taiwanese Master's Degree Correlation Chart
The statistical analysis conducted on geographies consisting of 357,699,051 people shows a substantial negative correlation between the proportion of Immigrants from El Salvador and percentage of population with at least master's degree education in the United States with a correlation coefficient (R) of -0.527 and weighted average of 12.0%. Similarly, the statistical analysis conducted on geographies consisting of 31,724,936 people shows a mild negative correlation between the proportion of Taiwanese and percentage of population with at least master's degree education in the United States with a correlation coefficient (R) of -0.337 and weighted average of 16.1%, a difference of 34.0%.
Master's Degree Correlation Summary
| Measurement | Immigrants from El Salvador | Taiwanese |
| Minimum | 0.61% | 1.1% |
| Maximum | 21.1% | 34.9% |
| Range | 20.5% | 33.8% |
| Mean | 9.7% | 15.4% |
| Median | 10.3% | 16.1% |
| Interquartile 25% (IQ1) | 6.8% | 10.2% |
| Interquartile 75% (IQ3) | 12.5% | 19.0% |
| Interquartile Range (IQR) | 5.7% | 8.8% |
| Standard Deviation (Sample) | 4.1% | 7.7% |
| Standard Deviation (Population) | 4.1% | 7.6% |
Similar Demographics by Master's Degree
Demographics Similar to Immigrants from El Salvador by Master's Degree
In terms of master's degree, the demographic groups most similar to Immigrants from El Salvador are Malaysian (12.0%, a difference of 0.31%), Honduran (11.9%, a difference of 0.41%), Immigrants from Dominican Republic (12.1%, a difference of 0.44%), Immigrants from Belize (12.1%, a difference of 0.49%), and Potawatomi (12.1%, a difference of 0.57%).
| Demographics | Rating | Rank | Master's Degree |
| Cubans | 0.3 /100 | #275 | Tragic 12.1% |
| Blacks/African Americans | 0.3 /100 | #276 | Tragic 12.1% |
| Immigrants | Caribbean | 0.3 /100 | #277 | Tragic 12.1% |
| Potawatomi | 0.3 /100 | #278 | Tragic 12.1% |
| Immigrants | Belize | 0.2 /100 | #279 | Tragic 12.1% |
| Immigrants | Dominican Republic | 0.2 /100 | #280 | Tragic 12.1% |
| Malaysians | 0.2 /100 | #281 | Tragic 12.0% |
| Immigrants | El Salvador | 0.2 /100 | #282 | Tragic 12.0% |
| Hondurans | 0.2 /100 | #283 | Tragic 11.9% |
| Ottawa | 0.2 /100 | #284 | Tragic 11.9% |
| Immigrants | Nicaragua | 0.2 /100 | #285 | Tragic 11.8% |
| Aleuts | 0.1 /100 | #286 | Tragic 11.8% |
| Immigrants | Haiti | 0.1 /100 | #287 | Tragic 11.8% |
| Immigrants | Honduras | 0.1 /100 | #288 | Tragic 11.8% |
| Guatemalans | 0.1 /100 | #289 | Tragic 11.7% |
Demographics Similar to Taiwanese by Master's Degree
In terms of master's degree, the demographic groups most similar to Taiwanese are Serbian (16.1%, a difference of 0.090%), Immigrants from Jordan (16.1%, a difference of 0.32%), Immigrants from Syria (16.2%, a difference of 0.58%), Immigrants from Sudan (16.0%, a difference of 0.63%), and Venezuelan (15.9%, a difference of 1.2%).
| Demographics | Rating | Rank | Master's Degree |
| Immigrants | Eritrea | 95.5 /100 | #124 | Exceptional 16.4% |
| Italians | 95.4 /100 | #125 | Exceptional 16.4% |
| Immigrants | Eastern Africa | 95.2 /100 | #126 | Exceptional 16.3% |
| Palestinians | 94.8 /100 | #127 | Exceptional 16.3% |
| Immigrants | Sierra Leone | 94.7 /100 | #128 | Exceptional 16.3% |
| Immigrants | Syria | 93.3 /100 | #129 | Exceptional 16.2% |
| Immigrants | Jordan | 92.7 /100 | #130 | Exceptional 16.1% |
| Taiwanese | 91.9 /100 | #131 | Exceptional 16.1% |
| Serbians | 91.7 /100 | #132 | Exceptional 16.1% |
| Immigrants | Sudan | 90.2 /100 | #133 | Exceptional 16.0% |
| Venezuelans | 88.4 /100 | #134 | Excellent 15.9% |
| South American Indians | 88.4 /100 | #135 | Excellent 15.9% |
| Assyrians/Chaldeans/Syriacs | 86.8 /100 | #136 | Excellent 15.8% |
| Europeans | 86.4 /100 | #137 | Excellent 15.8% |
| Pakistanis | 86.1 /100 | #138 | Excellent 15.8% |