Pakistani vs French Canadian Master's Degree
COMPARE
Pakistani
French Canadian
Master's Degree
Master's Degree Comparison
Pakistanis
French Canadians
15.8%
MASTER'S DEGREE
86.1/ 100
METRIC RATING
138th/ 347
METRIC RANK
14.1%
MASTER'S DEGREE
14.9/ 100
METRIC RATING
218th/ 347
METRIC RANK
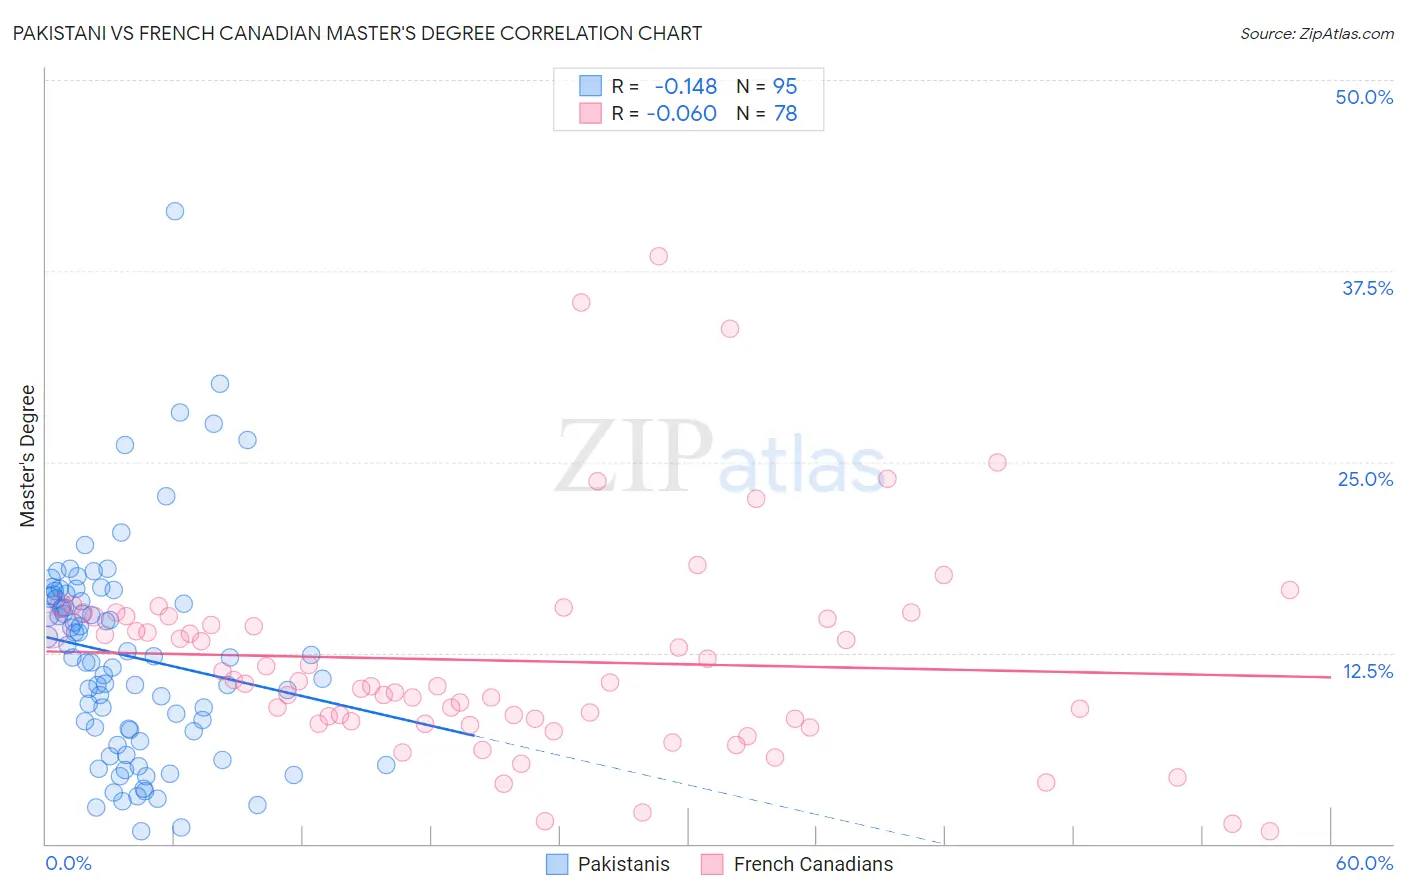
Pakistani vs French Canadian Master's Degree Correlation Chart
The statistical analysis conducted on geographies consisting of 335,288,248 people shows a poor negative correlation between the proportion of Pakistanis and percentage of population with at least master's degree education in the United States with a correlation coefficient (R) of -0.148 and weighted average of 15.8%. Similarly, the statistical analysis conducted on geographies consisting of 502,359,495 people shows a slight negative correlation between the proportion of French Canadians and percentage of population with at least master's degree education in the United States with a correlation coefficient (R) of -0.060 and weighted average of 14.1%, a difference of 12.1%.
Master's Degree Correlation Summary
| Measurement | Pakistani | French Canadian |
| Minimum | 0.80% | 0.81% |
| Maximum | 41.4% | 38.5% |
| Range | 40.6% | 37.6% |
| Mean | 12.3% | 12.0% |
| Median | 12.2% | 10.6% |
| Interquartile 25% (IQ1) | 7.4% | 8.0% |
| Interquartile 75% (IQ3) | 16.1% | 14.9% |
| Interquartile Range (IQR) | 8.7% | 6.9% |
| Standard Deviation (Sample) | 7.0% | 6.9% |
| Standard Deviation (Population) | 6.9% | 6.9% |
Similar Demographics by Master's Degree
Demographics Similar to Pakistanis by Master's Degree
In terms of master's degree, the demographic groups most similar to Pakistanis are Immigrants from Germany (15.8%, a difference of 0.060%), European (15.8%, a difference of 0.080%), Vietnamese (15.8%, a difference of 0.14%), Assyrian/Chaldean/Syriac (15.8%, a difference of 0.18%), and Polish (15.7%, a difference of 0.27%).
| Demographics | Rating | Rank | Master's Degree |
| Taiwanese | 91.9 /100 | #131 | Exceptional 16.1% |
| Serbians | 91.7 /100 | #132 | Exceptional 16.1% |
| Immigrants | Sudan | 90.2 /100 | #133 | Exceptional 16.0% |
| Venezuelans | 88.4 /100 | #134 | Excellent 15.9% |
| South American Indians | 88.4 /100 | #135 | Excellent 15.9% |
| Assyrians/Chaldeans/Syriacs | 86.8 /100 | #136 | Excellent 15.8% |
| Europeans | 86.4 /100 | #137 | Excellent 15.8% |
| Pakistanis | 86.1 /100 | #138 | Excellent 15.8% |
| Immigrants | Germany | 85.9 /100 | #139 | Excellent 15.8% |
| Vietnamese | 85.5 /100 | #140 | Excellent 15.8% |
| Poles | 85.0 /100 | #141 | Excellent 15.7% |
| Immigrants | Africa | 84.0 /100 | #142 | Excellent 15.7% |
| Immigrants | Venezuela | 83.6 /100 | #143 | Excellent 15.7% |
| Canadians | 83.3 /100 | #144 | Excellent 15.7% |
| South Americans | 81.3 /100 | #145 | Excellent 15.6% |
Demographics Similar to French Canadians by Master's Degree
In terms of master's degree, the demographic groups most similar to French Canadians are Immigrants from Somalia (14.1%, a difference of 0.25%), Immigrants from Trinidad and Tobago (14.1%, a difference of 0.25%), Immigrants from Vietnam (14.1%, a difference of 0.32%), Norwegian (14.0%, a difference of 0.35%), and German (14.0%, a difference of 0.50%).
| Demographics | Rating | Rank | Master's Degree |
| Somalis | 18.0 /100 | #211 | Poor 14.2% |
| Spanish | 17.8 /100 | #212 | Poor 14.2% |
| Immigrants | Thailand | 17.0 /100 | #213 | Poor 14.2% |
| Finns | 16.9 /100 | #214 | Poor 14.2% |
| Immigrants | Vietnam | 16.1 /100 | #215 | Poor 14.1% |
| Immigrants | Somalia | 15.8 /100 | #216 | Poor 14.1% |
| Immigrants | Trinidad and Tobago | 15.8 /100 | #217 | Poor 14.1% |
| French Canadians | 14.9 /100 | #218 | Poor 14.1% |
| Norwegians | 13.6 /100 | #219 | Poor 14.0% |
| Germans | 13.1 /100 | #220 | Poor 14.0% |
| Koreans | 12.7 /100 | #221 | Poor 14.0% |
| Ecuadorians | 12.6 /100 | #222 | Poor 14.0% |
| Immigrants | South Eastern Asia | 11.9 /100 | #223 | Poor 14.0% |
| Immigrants | Grenada | 11.8 /100 | #224 | Poor 14.0% |
| Portuguese | 11.2 /100 | #225 | Poor 13.9% |