Cuban vs French Canadian Master's Degree
COMPARE
Cuban
French Canadian
Master's Degree
Master's Degree Comparison
Cubans
French Canadians
12.1%
MASTER'S DEGREE
0.3/ 100
METRIC RATING
275th/ 347
METRIC RANK
14.1%
MASTER'S DEGREE
14.9/ 100
METRIC RATING
218th/ 347
METRIC RANK
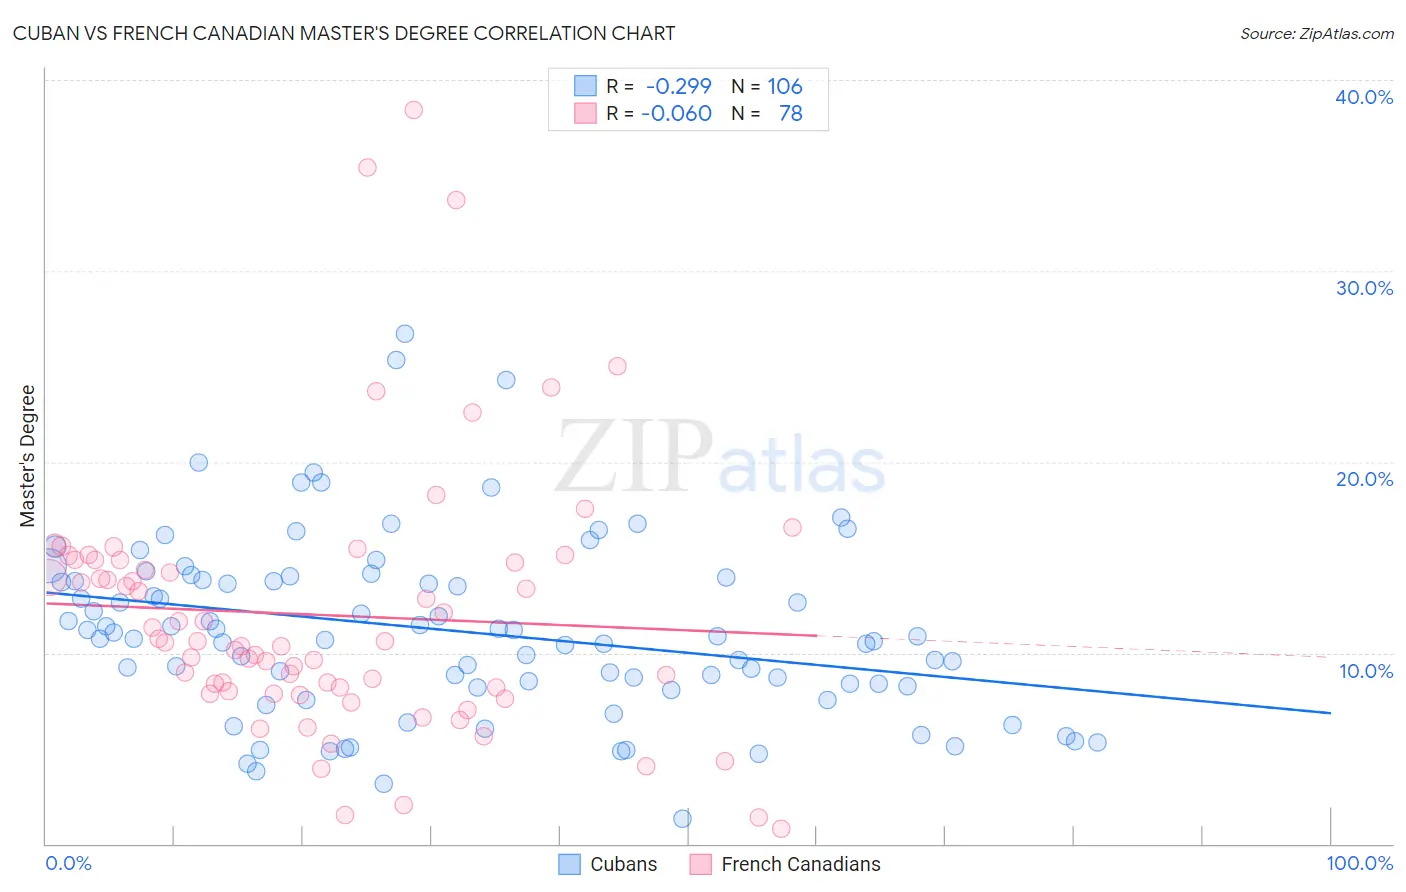
Cuban vs French Canadian Master's Degree Correlation Chart
The statistical analysis conducted on geographies consisting of 449,063,887 people shows a weak negative correlation between the proportion of Cubans and percentage of population with at least master's degree education in the United States with a correlation coefficient (R) of -0.299 and weighted average of 12.1%. Similarly, the statistical analysis conducted on geographies consisting of 502,359,495 people shows a slight negative correlation between the proportion of French Canadians and percentage of population with at least master's degree education in the United States with a correlation coefficient (R) of -0.060 and weighted average of 14.1%, a difference of 16.7%.
Master's Degree Correlation Summary
| Measurement | Cuban | French Canadian |
| Minimum | 1.3% | 0.81% |
| Maximum | 26.7% | 38.5% |
| Range | 25.4% | 37.6% |
| Mean | 11.1% | 12.0% |
| Median | 10.8% | 10.6% |
| Interquartile 25% (IQ1) | 8.3% | 8.0% |
| Interquartile 75% (IQ3) | 13.8% | 14.9% |
| Interquartile Range (IQR) | 5.5% | 6.9% |
| Standard Deviation (Sample) | 4.7% | 6.9% |
| Standard Deviation (Population) | 4.7% | 6.9% |
Similar Demographics by Master's Degree
Demographics Similar to Cubans by Master's Degree
In terms of master's degree, the demographic groups most similar to Cubans are Cape Verdean (12.1%, a difference of 0.020%), Black/African American (12.1%, a difference of 0.050%), Immigrants from Caribbean (12.1%, a difference of 0.060%), Potawatomi (12.1%, a difference of 0.070%), and Blackfeet (12.1%, a difference of 0.10%).
| Demographics | Rating | Rank | Master's Degree |
| Native Hawaiians | 0.4 /100 | #268 | Tragic 12.3% |
| Central Americans | 0.3 /100 | #269 | Tragic 12.2% |
| Salvadorans | 0.3 /100 | #270 | Tragic 12.2% |
| Haitians | 0.3 /100 | #271 | Tragic 12.1% |
| Comanche | 0.3 /100 | #272 | Tragic 12.1% |
| Blackfeet | 0.3 /100 | #273 | Tragic 12.1% |
| Cape Verdeans | 0.3 /100 | #274 | Tragic 12.1% |
| Cubans | 0.3 /100 | #275 | Tragic 12.1% |
| Blacks/African Americans | 0.3 /100 | #276 | Tragic 12.1% |
| Immigrants | Caribbean | 0.3 /100 | #277 | Tragic 12.1% |
| Potawatomi | 0.3 /100 | #278 | Tragic 12.1% |
| Immigrants | Belize | 0.2 /100 | #279 | Tragic 12.1% |
| Immigrants | Dominican Republic | 0.2 /100 | #280 | Tragic 12.1% |
| Malaysians | 0.2 /100 | #281 | Tragic 12.0% |
| Immigrants | El Salvador | 0.2 /100 | #282 | Tragic 12.0% |
Demographics Similar to French Canadians by Master's Degree
In terms of master's degree, the demographic groups most similar to French Canadians are Immigrants from Somalia (14.1%, a difference of 0.25%), Immigrants from Trinidad and Tobago (14.1%, a difference of 0.25%), Immigrants from Vietnam (14.1%, a difference of 0.32%), Norwegian (14.0%, a difference of 0.35%), and German (14.0%, a difference of 0.50%).
| Demographics | Rating | Rank | Master's Degree |
| Somalis | 18.0 /100 | #211 | Poor 14.2% |
| Spanish | 17.8 /100 | #212 | Poor 14.2% |
| Immigrants | Thailand | 17.0 /100 | #213 | Poor 14.2% |
| Finns | 16.9 /100 | #214 | Poor 14.2% |
| Immigrants | Vietnam | 16.1 /100 | #215 | Poor 14.1% |
| Immigrants | Somalia | 15.8 /100 | #216 | Poor 14.1% |
| Immigrants | Trinidad and Tobago | 15.8 /100 | #217 | Poor 14.1% |
| French Canadians | 14.9 /100 | #218 | Poor 14.1% |
| Norwegians | 13.6 /100 | #219 | Poor 14.0% |
| Germans | 13.1 /100 | #220 | Poor 14.0% |
| Koreans | 12.7 /100 | #221 | Poor 14.0% |
| Ecuadorians | 12.6 /100 | #222 | Poor 14.0% |
| Immigrants | South Eastern Asia | 11.9 /100 | #223 | Poor 14.0% |
| Immigrants | Grenada | 11.8 /100 | #224 | Poor 14.0% |
| Portuguese | 11.2 /100 | #225 | Poor 13.9% |