Argentinean vs French Canadian Master's Degree
COMPARE
Argentinean
French Canadian
Master's Degree
Master's Degree Comparison
Argentineans
French Canadians
18.2%
MASTER'S DEGREE
99.9/ 100
METRIC RATING
62nd/ 347
METRIC RANK
14.1%
MASTER'S DEGREE
14.9/ 100
METRIC RATING
218th/ 347
METRIC RANK
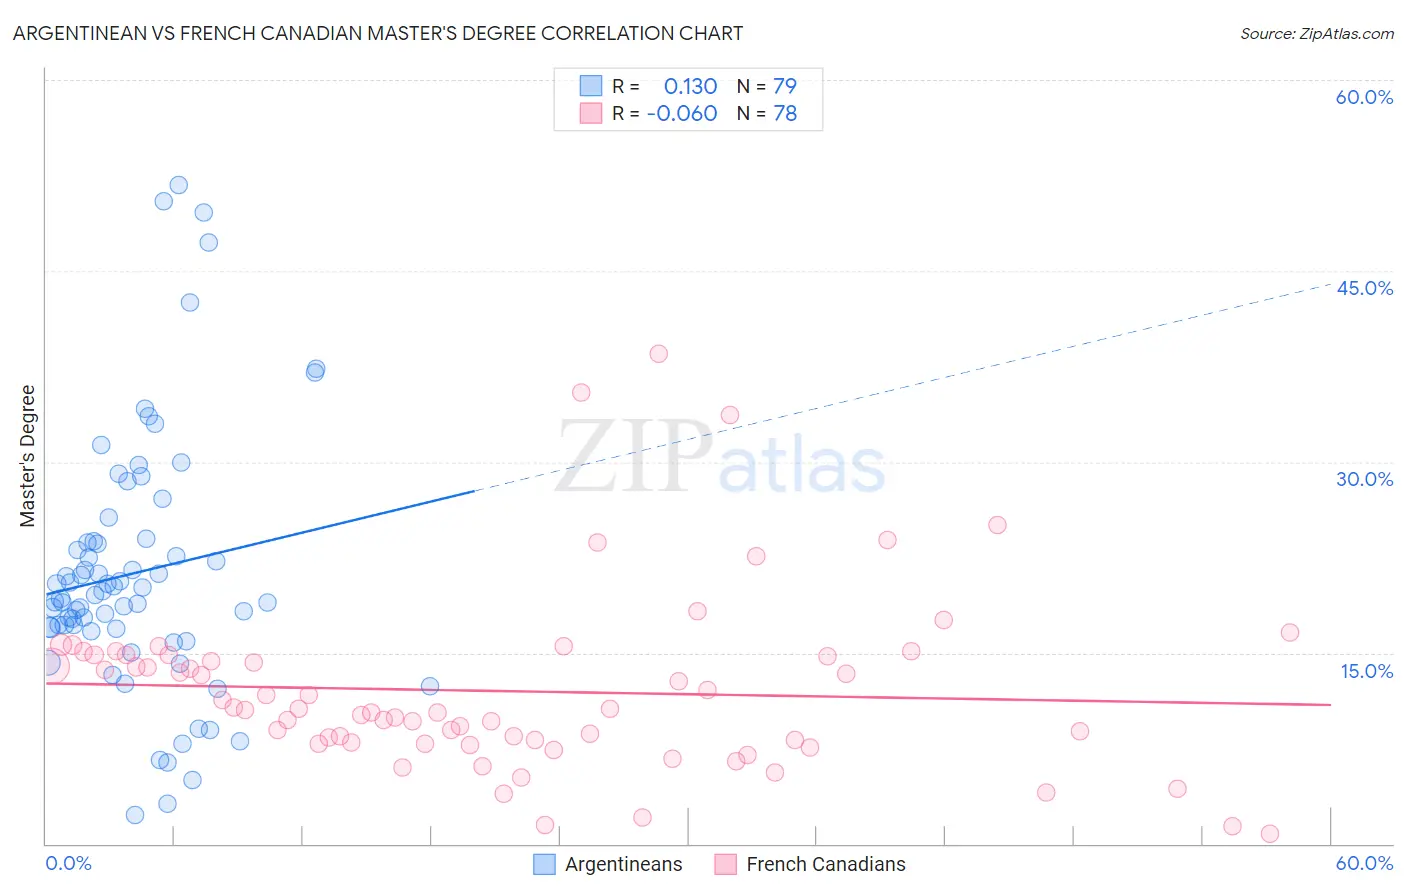
Argentinean vs French Canadian Master's Degree Correlation Chart
The statistical analysis conducted on geographies consisting of 297,078,027 people shows a poor positive correlation between the proportion of Argentineans and percentage of population with at least master's degree education in the United States with a correlation coefficient (R) of 0.130 and weighted average of 18.2%. Similarly, the statistical analysis conducted on geographies consisting of 502,359,495 people shows a slight negative correlation between the proportion of French Canadians and percentage of population with at least master's degree education in the United States with a correlation coefficient (R) of -0.060 and weighted average of 14.1%, a difference of 29.0%.
Master's Degree Correlation Summary
| Measurement | Argentinean | French Canadian |
| Minimum | 2.2% | 0.81% |
| Maximum | 51.7% | 38.5% |
| Range | 49.5% | 37.6% |
| Mean | 21.3% | 12.0% |
| Median | 19.5% | 10.6% |
| Interquartile 25% (IQ1) | 16.9% | 8.0% |
| Interquartile 75% (IQ3) | 23.8% | 14.9% |
| Interquartile Range (IQR) | 6.9% | 6.9% |
| Standard Deviation (Sample) | 10.1% | 6.9% |
| Standard Deviation (Population) | 10.0% | 6.9% |
Similar Demographics by Master's Degree
Demographics Similar to Argentineans by Master's Degree
In terms of master's degree, the demographic groups most similar to Argentineans are Immigrants from Europe (18.2%, a difference of 0.36%), Immigrants from Netherlands (18.1%, a difference of 0.36%), South African (18.1%, a difference of 0.44%), New Zealander (18.3%, a difference of 0.51%), and Immigrants from Bulgaria (18.3%, a difference of 0.74%).
| Demographics | Rating | Rank | Master's Degree |
| Immigrants | Serbia | 99.9 /100 | #55 | Exceptional 18.5% |
| Asians | 99.9 /100 | #56 | Exceptional 18.4% |
| Immigrants | Asia | 99.9 /100 | #57 | Exceptional 18.4% |
| Australians | 99.9 /100 | #58 | Exceptional 18.4% |
| Immigrants | Bulgaria | 99.9 /100 | #59 | Exceptional 18.3% |
| New Zealanders | 99.9 /100 | #60 | Exceptional 18.3% |
| Immigrants | Europe | 99.9 /100 | #61 | Exceptional 18.2% |
| Argentineans | 99.9 /100 | #62 | Exceptional 18.2% |
| Immigrants | Netherlands | 99.9 /100 | #63 | Exceptional 18.1% |
| South Africans | 99.9 /100 | #64 | Exceptional 18.1% |
| Immigrants | Kazakhstan | 99.8 /100 | #65 | Exceptional 18.0% |
| Ethiopians | 99.8 /100 | #66 | Exceptional 18.0% |
| Immigrants | Argentina | 99.8 /100 | #67 | Exceptional 18.0% |
| Immigrants | Ethiopia | 99.8 /100 | #68 | Exceptional 17.9% |
| Immigrants | Uzbekistan | 99.8 /100 | #69 | Exceptional 17.9% |
Demographics Similar to French Canadians by Master's Degree
In terms of master's degree, the demographic groups most similar to French Canadians are Immigrants from Somalia (14.1%, a difference of 0.25%), Immigrants from Trinidad and Tobago (14.1%, a difference of 0.25%), Immigrants from Vietnam (14.1%, a difference of 0.32%), Norwegian (14.0%, a difference of 0.35%), and German (14.0%, a difference of 0.50%).
| Demographics | Rating | Rank | Master's Degree |
| Somalis | 18.0 /100 | #211 | Poor 14.2% |
| Spanish | 17.8 /100 | #212 | Poor 14.2% |
| Immigrants | Thailand | 17.0 /100 | #213 | Poor 14.2% |
| Finns | 16.9 /100 | #214 | Poor 14.2% |
| Immigrants | Vietnam | 16.1 /100 | #215 | Poor 14.1% |
| Immigrants | Somalia | 15.8 /100 | #216 | Poor 14.1% |
| Immigrants | Trinidad and Tobago | 15.8 /100 | #217 | Poor 14.1% |
| French Canadians | 14.9 /100 | #218 | Poor 14.1% |
| Norwegians | 13.6 /100 | #219 | Poor 14.0% |
| Germans | 13.1 /100 | #220 | Poor 14.0% |
| Koreans | 12.7 /100 | #221 | Poor 14.0% |
| Ecuadorians | 12.6 /100 | #222 | Poor 14.0% |
| Immigrants | South Eastern Asia | 11.9 /100 | #223 | Poor 14.0% |
| Immigrants | Grenada | 11.8 /100 | #224 | Poor 14.0% |
| Portuguese | 11.2 /100 | #225 | Poor 13.9% |