Nepalese vs Immigrants from Thailand GED/Equivalency
COMPARE
Nepalese
Immigrants from Thailand
GED/Equivalency
GED/Equivalency Comparison
Nepalese
Immigrants from Thailand
81.9%
GED/EQUIVALENCY
0.0/ 100
METRIC RATING
295th/ 347
METRIC RANK
84.5%
GED/EQUIVALENCY
5.8/ 100
METRIC RATING
225th/ 347
METRIC RANK
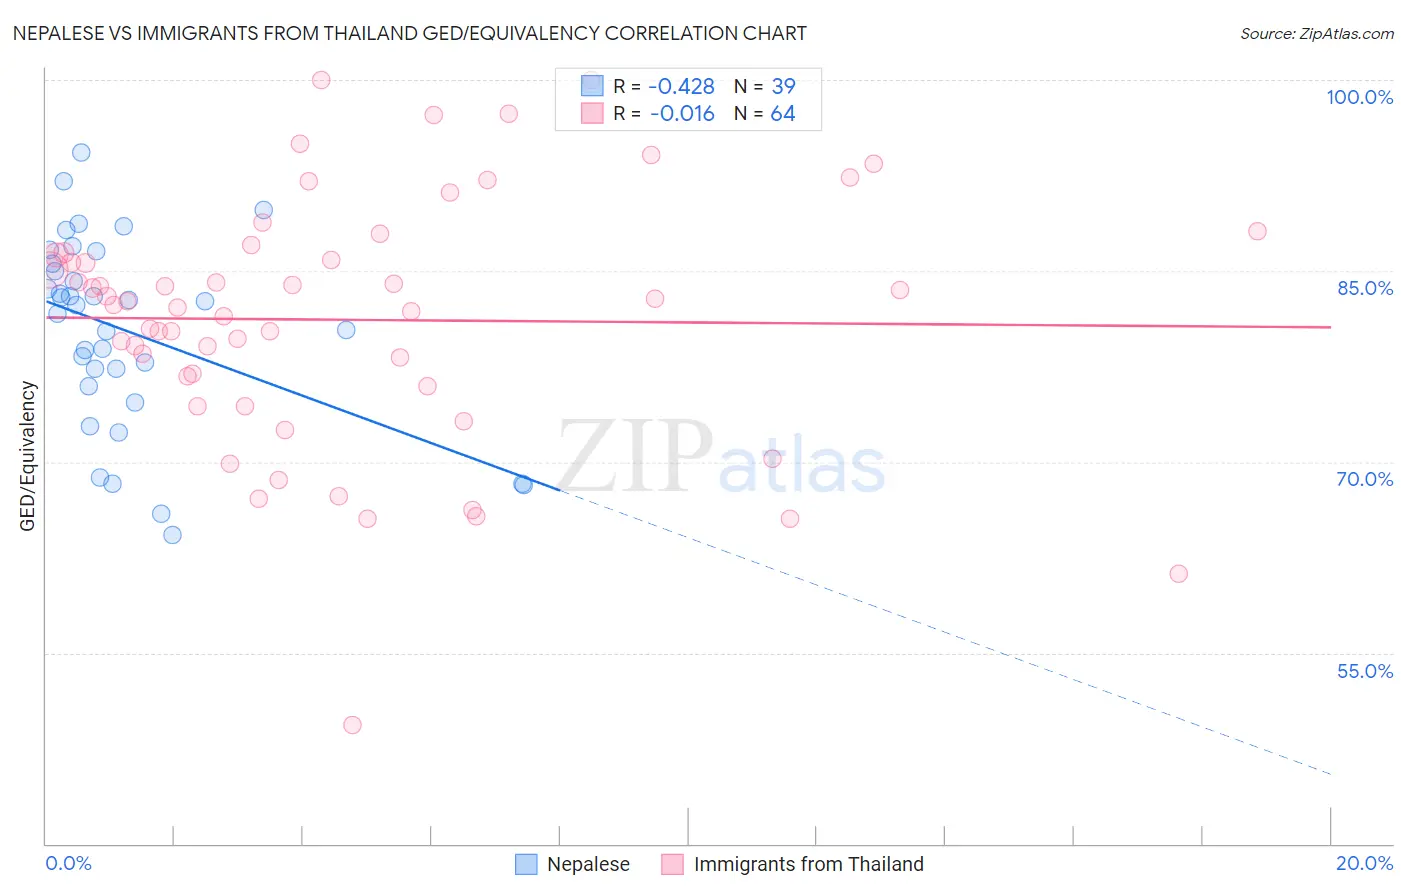
Nepalese vs Immigrants from Thailand GED/Equivalency Correlation Chart
The statistical analysis conducted on geographies consisting of 24,519,269 people shows a moderate negative correlation between the proportion of Nepalese and percentage of population with at least ged/equivalency education in the United States with a correlation coefficient (R) of -0.428 and weighted average of 81.9%. Similarly, the statistical analysis conducted on geographies consisting of 317,022,868 people shows no correlation between the proportion of Immigrants from Thailand and percentage of population with at least ged/equivalency education in the United States with a correlation coefficient (R) of -0.016 and weighted average of 84.5%, a difference of 3.2%.
GED/Equivalency Correlation Summary
| Measurement | Nepalese | Immigrants from Thailand |
| Minimum | 64.2% | 49.4% |
| Maximum | 94.3% | 100.0% |
| Range | 30.1% | 50.6% |
| Mean | 80.3% | 81.2% |
| Median | 82.3% | 82.5% |
| Interquartile 25% (IQ1) | 75.9% | 76.4% |
| Interquartile 75% (IQ3) | 85.5% | 86.3% |
| Interquartile Range (IQR) | 9.6% | 10.0% |
| Standard Deviation (Sample) | 7.4% | 9.8% |
| Standard Deviation (Population) | 7.4% | 9.7% |
Similar Demographics by GED/Equivalency
Demographics Similar to Nepalese by GED/Equivalency
In terms of ged/equivalency, the demographic groups most similar to Nepalese are Vietnamese (81.9%, a difference of 0.030%), Immigrants from St. Vincent and the Grenadines (82.0%, a difference of 0.060%), Immigrants from Bangladesh (81.9%, a difference of 0.070%), British West Indian (82.0%, a difference of 0.080%), and Paiute (82.0%, a difference of 0.090%).
| Demographics | Rating | Rank | GED/Equivalency |
| Pueblo | 0.0 /100 | #288 | Tragic 82.3% |
| Immigrants | Cambodia | 0.0 /100 | #289 | Tragic 82.2% |
| Haitians | 0.0 /100 | #290 | Tragic 82.1% |
| Cubans | 0.0 /100 | #291 | Tragic 82.0% |
| Paiute | 0.0 /100 | #292 | Tragic 82.0% |
| British West Indians | 0.0 /100 | #293 | Tragic 82.0% |
| Immigrants | St. Vincent and the Grenadines | 0.0 /100 | #294 | Tragic 82.0% |
| Nepalese | 0.0 /100 | #295 | Tragic 81.9% |
| Vietnamese | 0.0 /100 | #296 | Tragic 81.9% |
| Immigrants | Bangladesh | 0.0 /100 | #297 | Tragic 81.9% |
| Ute | 0.0 /100 | #298 | Tragic 81.8% |
| Ecuadorians | 0.0 /100 | #299 | Tragic 81.7% |
| Fijians | 0.0 /100 | #300 | Tragic 81.6% |
| Dutch West Indians | 0.0 /100 | #301 | Tragic 81.6% |
| Immigrants | Haiti | 0.0 /100 | #302 | Tragic 81.6% |
Demographics Similar to Immigrants from Thailand by GED/Equivalency
In terms of ged/equivalency, the demographic groups most similar to Immigrants from Thailand are Immigrants from Zaire (84.5%, a difference of 0.020%), Immigrants from Costa Rica (84.5%, a difference of 0.040%), French American Indian (84.6%, a difference of 0.050%), Immigrants from Liberia (84.4%, a difference of 0.090%), and Immigrants from Uzbekistan (84.6%, a difference of 0.12%).
| Demographics | Rating | Rank | GED/Equivalency |
| Alaska Natives | 8.6 /100 | #218 | Tragic 84.7% |
| Potawatomi | 8.2 /100 | #219 | Tragic 84.7% |
| Americans | 8.2 /100 | #220 | Tragic 84.7% |
| Taiwanese | 8.1 /100 | #221 | Tragic 84.7% |
| Iroquois | 7.5 /100 | #222 | Tragic 84.6% |
| Immigrants | Uzbekistan | 7.1 /100 | #223 | Tragic 84.6% |
| French American Indians | 6.3 /100 | #224 | Tragic 84.6% |
| Immigrants | Thailand | 5.8 /100 | #225 | Tragic 84.5% |
| Immigrants | Zaire | 5.5 /100 | #226 | Tragic 84.5% |
| Immigrants | Costa Rica | 5.4 /100 | #227 | Tragic 84.5% |
| Immigrants | Liberia | 4.9 /100 | #228 | Tragic 84.4% |
| Immigrants | Uruguay | 4.6 /100 | #229 | Tragic 84.4% |
| Immigrants | Colombia | 4.5 /100 | #230 | Tragic 84.4% |
| Immigrants | Middle Africa | 4.3 /100 | #231 | Tragic 84.4% |
| Immigrants | South America | 4.2 /100 | #232 | Tragic 84.4% |