Native/Alaskan vs Immigrants from Iran Doctorate Degree
COMPARE
Native/Alaskan
Immigrants from Iran
Doctorate Degree
Doctorate Degree Comparison
Natives/Alaskans
Immigrants from Iran
1.3%
DOCTORATE DEGREE
0.0/ 100
METRIC RATING
324th/ 347
METRIC RANK
3.0%
DOCTORATE DEGREE
100.0/ 100
METRIC RATING
9th/ 347
METRIC RANK
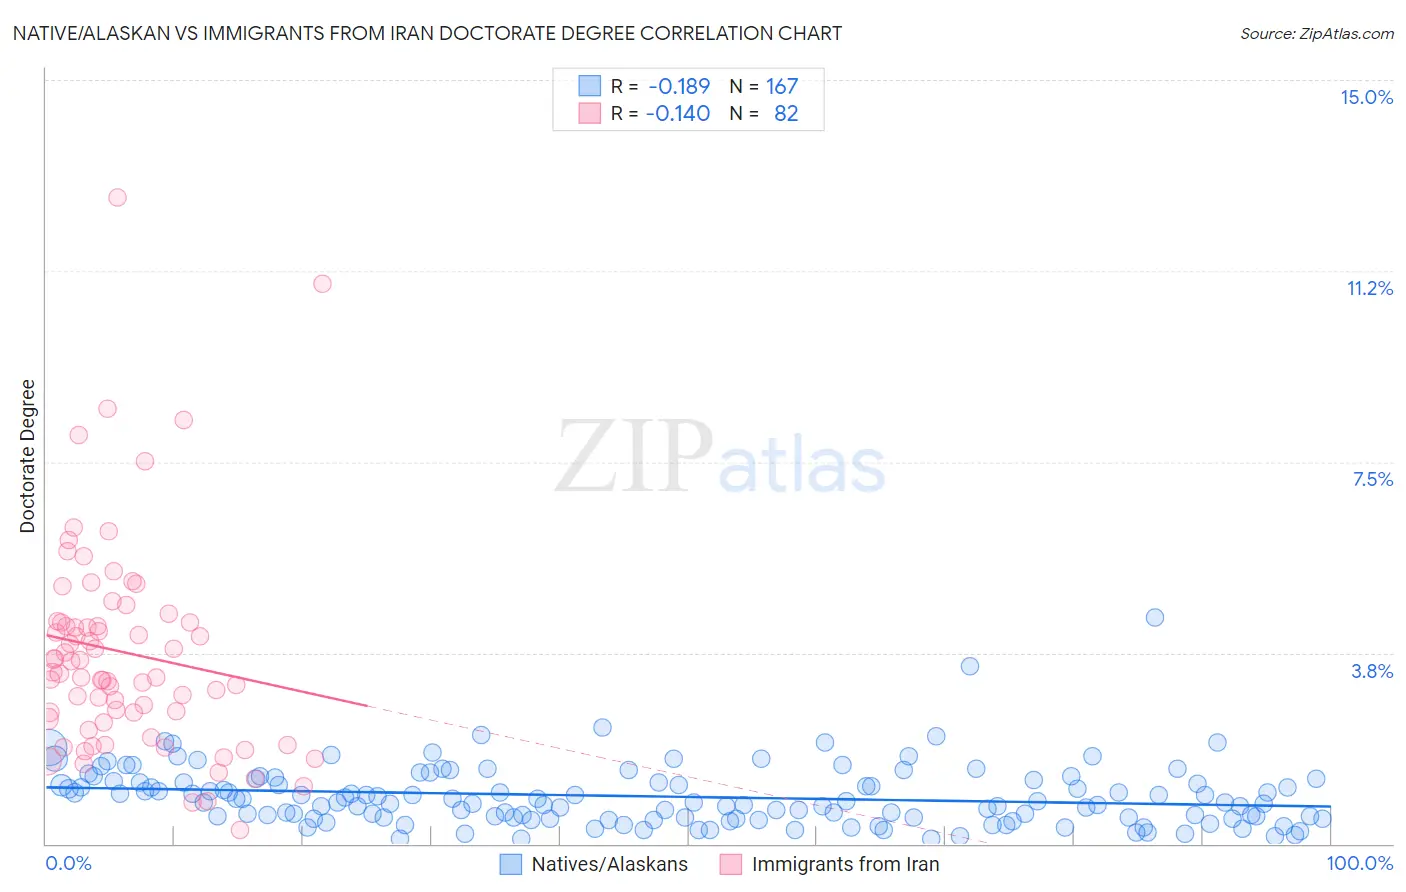
Native/Alaskan vs Immigrants from Iran Doctorate Degree Correlation Chart
The statistical analysis conducted on geographies consisting of 497,415,117 people shows a poor negative correlation between the proportion of Natives/Alaskans and percentage of population with at least doctorate degree education in the United States with a correlation coefficient (R) of -0.189 and weighted average of 1.3%. Similarly, the statistical analysis conducted on geographies consisting of 279,321,520 people shows a poor negative correlation between the proportion of Immigrants from Iran and percentage of population with at least doctorate degree education in the United States with a correlation coefficient (R) of -0.140 and weighted average of 3.0%, a difference of 128.6%.
Doctorate Degree Correlation Summary
| Measurement | Native/Alaskan | Immigrants from Iran |
| Minimum | 0.087% | 0.26% |
| Maximum | 4.4% | 12.7% |
| Range | 4.3% | 12.4% |
| Mean | 0.93% | 3.8% |
| Median | 0.81% | 3.4% |
| Interquartile 25% (IQ1) | 0.51% | 2.5% |
| Interquartile 75% (IQ3) | 1.2% | 4.4% |
| Interquartile Range (IQR) | 0.72% | 1.9% |
| Standard Deviation (Sample) | 0.60% | 2.1% |
| Standard Deviation (Population) | 0.60% | 2.1% |
Similar Demographics by Doctorate Degree
Demographics Similar to Natives/Alaskans by Doctorate Degree
In terms of doctorate degree, the demographic groups most similar to Natives/Alaskans are Immigrants from Belize (1.3%, a difference of 0.32%), Pima (1.3%, a difference of 0.39%), Immigrants from Cabo Verde (1.3%, a difference of 0.41%), Seminole (1.3%, a difference of 0.52%), and Dutch West Indian (1.3%, a difference of 0.58%).
| Demographics | Rating | Rank | Doctorate Degree |
| Immigrants | Micronesia | 0.1 /100 | #317 | Tragic 1.3% |
| Creek | 0.1 /100 | #318 | Tragic 1.3% |
| Immigrants | Guyana | 0.1 /100 | #319 | Tragic 1.3% |
| Immigrants | St. Vincent and the Grenadines | 0.1 /100 | #320 | Tragic 1.3% |
| Dutch West Indians | 0.1 /100 | #321 | Tragic 1.3% |
| Seminole | 0.1 /100 | #322 | Tragic 1.3% |
| Immigrants | Belize | 0.1 /100 | #323 | Tragic 1.3% |
| Natives/Alaskans | 0.0 /100 | #324 | Tragic 1.3% |
| Pima | 0.0 /100 | #325 | Tragic 1.3% |
| Immigrants | Cabo Verde | 0.0 /100 | #326 | Tragic 1.3% |
| Hispanics or Latinos | 0.0 /100 | #327 | Tragic 1.3% |
| Inupiat | 0.0 /100 | #328 | Tragic 1.3% |
| Haitians | 0.0 /100 | #329 | Tragic 1.3% |
| Yup'ik | 0.0 /100 | #330 | Tragic 1.3% |
| Immigrants | Latin America | 0.0 /100 | #331 | Tragic 1.3% |
Demographics Similar to Immigrants from Iran by Doctorate Degree
In terms of doctorate degree, the demographic groups most similar to Immigrants from Iran are Immigrants from Israel (3.0%, a difference of 0.67%), Immigrants from China (3.1%, a difference of 2.0%), Immigrants from Switzerland (3.1%, a difference of 2.1%), Immigrants from Eastern Asia (3.0%, a difference of 2.1%), and Iranian (3.1%, a difference of 4.0%).
| Demographics | Rating | Rank | Doctorate Degree |
| Filipinos | 100.0 /100 | #2 | Exceptional 3.4% |
| Okinawans | 100.0 /100 | #3 | Exceptional 3.3% |
| Immigrants | Taiwan | 100.0 /100 | #4 | Exceptional 3.2% |
| Iranians | 100.0 /100 | #5 | Exceptional 3.1% |
| Immigrants | Switzerland | 100.0 /100 | #6 | Exceptional 3.1% |
| Immigrants | China | 100.0 /100 | #7 | Exceptional 3.1% |
| Immigrants | Israel | 100.0 /100 | #8 | Exceptional 3.0% |
| Immigrants | Iran | 100.0 /100 | #9 | Exceptional 3.0% |
| Immigrants | Eastern Asia | 100.0 /100 | #10 | Exceptional 3.0% |
| Indians (Asian) | 100.0 /100 | #11 | Exceptional 2.9% |
| Immigrants | Belgium | 100.0 /100 | #12 | Exceptional 2.9% |
| Immigrants | Sweden | 100.0 /100 | #13 | Exceptional 2.9% |
| Immigrants | France | 100.0 /100 | #14 | Exceptional 2.9% |
| Immigrants | India | 100.0 /100 | #15 | Exceptional 2.8% |
| Eastern Europeans | 100.0 /100 | #16 | Exceptional 2.8% |