Native/Alaskan vs French Doctorate Degree
COMPARE
Native/Alaskan
French
Doctorate Degree
Doctorate Degree Comparison
Natives/Alaskans
French
1.3%
DOCTORATE DEGREE
0.0/ 100
METRIC RATING
324th/ 347
METRIC RANK
1.8%
DOCTORATE DEGREE
48.8/ 100
METRIC RATING
178th/ 347
METRIC RANK
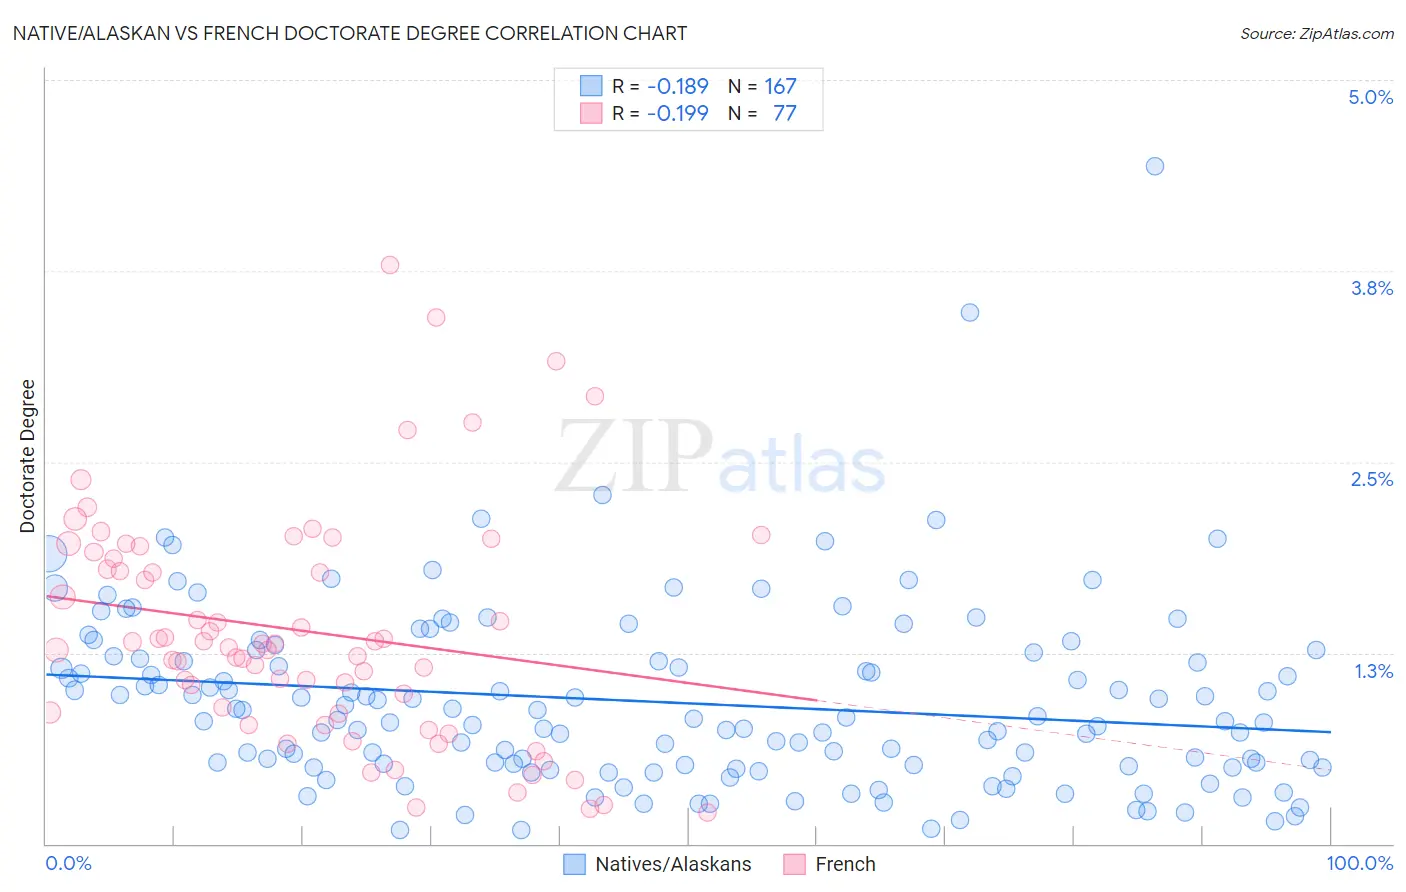
Native/Alaskan vs French Doctorate Degree Correlation Chart
The statistical analysis conducted on geographies consisting of 497,415,117 people shows a poor negative correlation between the proportion of Natives/Alaskans and percentage of population with at least doctorate degree education in the United States with a correlation coefficient (R) of -0.189 and weighted average of 1.3%. Similarly, the statistical analysis conducted on geographies consisting of 547,467,794 people shows a poor negative correlation between the proportion of French and percentage of population with at least doctorate degree education in the United States with a correlation coefficient (R) of -0.199 and weighted average of 1.8%, a difference of 38.6%.
Doctorate Degree Correlation Summary
| Measurement | Native/Alaskan | French |
| Minimum | 0.087% | 0.20% |
| Maximum | 4.4% | 3.8% |
| Range | 4.3% | 3.6% |
| Mean | 0.93% | 1.4% |
| Median | 0.81% | 1.3% |
| Interquartile 25% (IQ1) | 0.51% | 0.86% |
| Interquartile 75% (IQ3) | 1.2% | 1.9% |
| Interquartile Range (IQR) | 0.72% | 1.0% |
| Standard Deviation (Sample) | 0.60% | 0.75% |
| Standard Deviation (Population) | 0.60% | 0.74% |
Similar Demographics by Doctorate Degree
Demographics Similar to Natives/Alaskans by Doctorate Degree
In terms of doctorate degree, the demographic groups most similar to Natives/Alaskans are Immigrants from Belize (1.3%, a difference of 0.32%), Pima (1.3%, a difference of 0.39%), Immigrants from Cabo Verde (1.3%, a difference of 0.41%), Seminole (1.3%, a difference of 0.52%), and Dutch West Indian (1.3%, a difference of 0.58%).
| Demographics | Rating | Rank | Doctorate Degree |
| Immigrants | Micronesia | 0.1 /100 | #317 | Tragic 1.3% |
| Creek | 0.1 /100 | #318 | Tragic 1.3% |
| Immigrants | Guyana | 0.1 /100 | #319 | Tragic 1.3% |
| Immigrants | St. Vincent and the Grenadines | 0.1 /100 | #320 | Tragic 1.3% |
| Dutch West Indians | 0.1 /100 | #321 | Tragic 1.3% |
| Seminole | 0.1 /100 | #322 | Tragic 1.3% |
| Immigrants | Belize | 0.1 /100 | #323 | Tragic 1.3% |
| Natives/Alaskans | 0.0 /100 | #324 | Tragic 1.3% |
| Pima | 0.0 /100 | #325 | Tragic 1.3% |
| Immigrants | Cabo Verde | 0.0 /100 | #326 | Tragic 1.3% |
| Hispanics or Latinos | 0.0 /100 | #327 | Tragic 1.3% |
| Inupiat | 0.0 /100 | #328 | Tragic 1.3% |
| Haitians | 0.0 /100 | #329 | Tragic 1.3% |
| Yup'ik | 0.0 /100 | #330 | Tragic 1.3% |
| Immigrants | Latin America | 0.0 /100 | #331 | Tragic 1.3% |
Demographics Similar to French by Doctorate Degree
In terms of doctorate degree, the demographic groups most similar to French are Iraqi (1.8%, a difference of 0.060%), Spanish (1.8%, a difference of 0.070%), Ghanaian (1.8%, a difference of 0.070%), Immigrants from Thailand (1.8%, a difference of 0.090%), and Scandinavian (1.8%, a difference of 0.12%).
| Demographics | Rating | Rank | Doctorate Degree |
| Bermudans | 52.1 /100 | #171 | Average 1.8% |
| Belgians | 50.3 /100 | #172 | Average 1.8% |
| Norwegians | 50.0 /100 | #173 | Average 1.8% |
| Immigrants | Bangladesh | 50.0 /100 | #174 | Average 1.8% |
| Immigrants | Thailand | 49.4 /100 | #175 | Average 1.8% |
| Spanish | 49.3 /100 | #176 | Average 1.8% |
| Iraqis | 49.2 /100 | #177 | Average 1.8% |
| French | 48.8 /100 | #178 | Average 1.8% |
| Ghanaians | 48.3 /100 | #179 | Average 1.8% |
| Scandinavians | 48.0 /100 | #180 | Average 1.8% |
| Immigrants | Immigrants | 46.2 /100 | #181 | Average 1.8% |
| Immigrants | Afghanistan | 44.3 /100 | #182 | Average 1.8% |
| Finns | 42.1 /100 | #183 | Average 1.8% |
| Nigerians | 39.9 /100 | #184 | Fair 1.8% |
| Slovaks | 36.4 /100 | #185 | Fair 1.8% |