Native/Alaskan vs Immigrants from Albania Doctorate Degree
COMPARE
Native/Alaskan
Immigrants from Albania
Doctorate Degree
Doctorate Degree Comparison
Natives/Alaskans
Immigrants from Albania
1.3%
DOCTORATE DEGREE
0.0/ 100
METRIC RATING
324th/ 347
METRIC RANK
1.9%
DOCTORATE DEGREE
72.8/ 100
METRIC RATING
154th/ 347
METRIC RANK
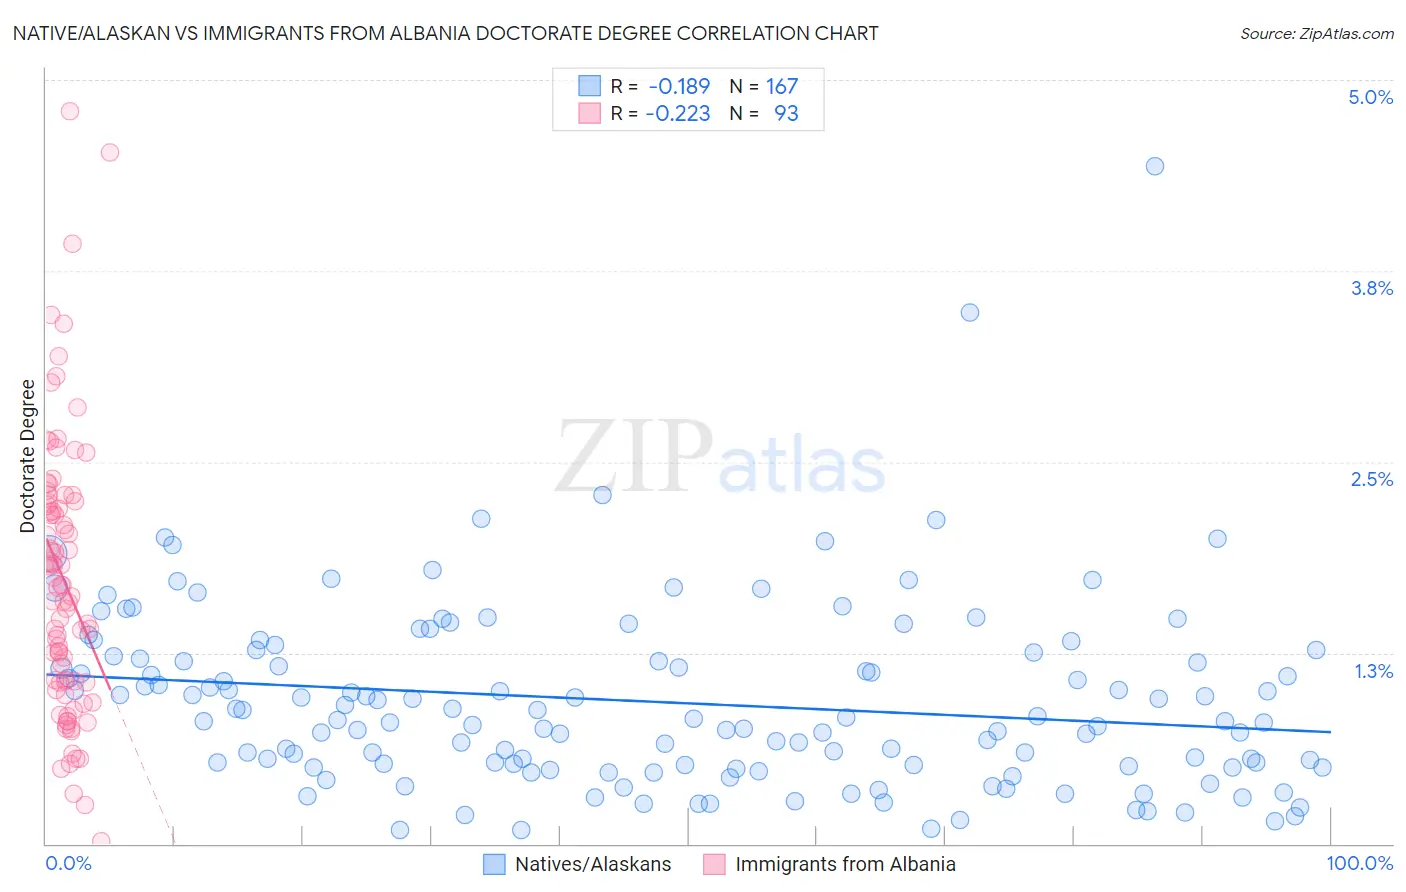
Native/Alaskan vs Immigrants from Albania Doctorate Degree Correlation Chart
The statistical analysis conducted on geographies consisting of 497,415,117 people shows a poor negative correlation between the proportion of Natives/Alaskans and percentage of population with at least doctorate degree education in the United States with a correlation coefficient (R) of -0.189 and weighted average of 1.3%. Similarly, the statistical analysis conducted on geographies consisting of 119,213,784 people shows a weak negative correlation between the proportion of Immigrants from Albania and percentage of population with at least doctorate degree education in the United States with a correlation coefficient (R) of -0.223 and weighted average of 1.9%, a difference of 43.9%.
Doctorate Degree Correlation Summary
| Measurement | Native/Alaskan | Immigrants from Albania |
| Minimum | 0.087% | 0.013% |
| Maximum | 4.4% | 4.8% |
| Range | 4.3% | 4.8% |
| Mean | 0.93% | 1.7% |
| Median | 0.81% | 1.7% |
| Interquartile 25% (IQ1) | 0.51% | 1.1% |
| Interquartile 75% (IQ3) | 1.2% | 2.2% |
| Interquartile Range (IQR) | 0.72% | 1.2% |
| Standard Deviation (Sample) | 0.60% | 0.90% |
| Standard Deviation (Population) | 0.60% | 0.89% |
Similar Demographics by Doctorate Degree
Demographics Similar to Natives/Alaskans by Doctorate Degree
In terms of doctorate degree, the demographic groups most similar to Natives/Alaskans are Immigrants from Belize (1.3%, a difference of 0.32%), Pima (1.3%, a difference of 0.39%), Immigrants from Cabo Verde (1.3%, a difference of 0.41%), Seminole (1.3%, a difference of 0.52%), and Dutch West Indian (1.3%, a difference of 0.58%).
| Demographics | Rating | Rank | Doctorate Degree |
| Immigrants | Micronesia | 0.1 /100 | #317 | Tragic 1.3% |
| Creek | 0.1 /100 | #318 | Tragic 1.3% |
| Immigrants | Guyana | 0.1 /100 | #319 | Tragic 1.3% |
| Immigrants | St. Vincent and the Grenadines | 0.1 /100 | #320 | Tragic 1.3% |
| Dutch West Indians | 0.1 /100 | #321 | Tragic 1.3% |
| Seminole | 0.1 /100 | #322 | Tragic 1.3% |
| Immigrants | Belize | 0.1 /100 | #323 | Tragic 1.3% |
| Natives/Alaskans | 0.0 /100 | #324 | Tragic 1.3% |
| Pima | 0.0 /100 | #325 | Tragic 1.3% |
| Immigrants | Cabo Verde | 0.0 /100 | #326 | Tragic 1.3% |
| Hispanics or Latinos | 0.0 /100 | #327 | Tragic 1.3% |
| Inupiat | 0.0 /100 | #328 | Tragic 1.3% |
| Haitians | 0.0 /100 | #329 | Tragic 1.3% |
| Yup'ik | 0.0 /100 | #330 | Tragic 1.3% |
| Immigrants | Latin America | 0.0 /100 | #331 | Tragic 1.3% |
Demographics Similar to Immigrants from Albania by Doctorate Degree
In terms of doctorate degree, the demographic groups most similar to Immigrants from Albania are Polish (1.9%, a difference of 0.020%), Slavic (1.9%, a difference of 0.080%), Danish (1.9%, a difference of 0.16%), Hungarian (1.9%, a difference of 0.19%), and Immigrants from Oceania (1.9%, a difference of 0.22%).
| Demographics | Rating | Rank | Doctorate Degree |
| Immigrants | Senegal | 82.5 /100 | #147 | Excellent 1.9% |
| Luxembourgers | 81.1 /100 | #148 | Excellent 1.9% |
| Basques | 76.9 /100 | #149 | Good 1.9% |
| English | 75.9 /100 | #150 | Good 1.9% |
| Albanians | 74.8 /100 | #151 | Good 1.9% |
| Immigrants | Kenya | 74.3 /100 | #152 | Good 1.9% |
| Immigrants | Oceania | 74.0 /100 | #153 | Good 1.9% |
| Immigrants | Albania | 72.8 /100 | #154 | Good 1.9% |
| Poles | 72.7 /100 | #155 | Good 1.9% |
| Slavs | 72.4 /100 | #156 | Good 1.9% |
| Danes | 71.9 /100 | #157 | Good 1.9% |
| Hungarians | 71.7 /100 | #158 | Good 1.9% |
| Slovenes | 70.2 /100 | #159 | Good 1.9% |
| Welsh | 69.7 /100 | #160 | Good 1.9% |
| Immigrants | Middle Africa | 68.8 /100 | #161 | Good 1.9% |