Native Hawaiian vs Immigrants from Poland Associate's Degree
COMPARE
Native Hawaiian
Immigrants from Poland
Associate's Degree
Associate's Degree Comparison
Native Hawaiians
Immigrants from Poland
43.1%
ASSOCIATE'S DEGREE
2.3/ 100
METRIC RATING
232nd/ 347
METRIC RANK
47.1%
ASSOCIATE'S DEGREE
69.2/ 100
METRIC RATING
159th/ 347
METRIC RANK
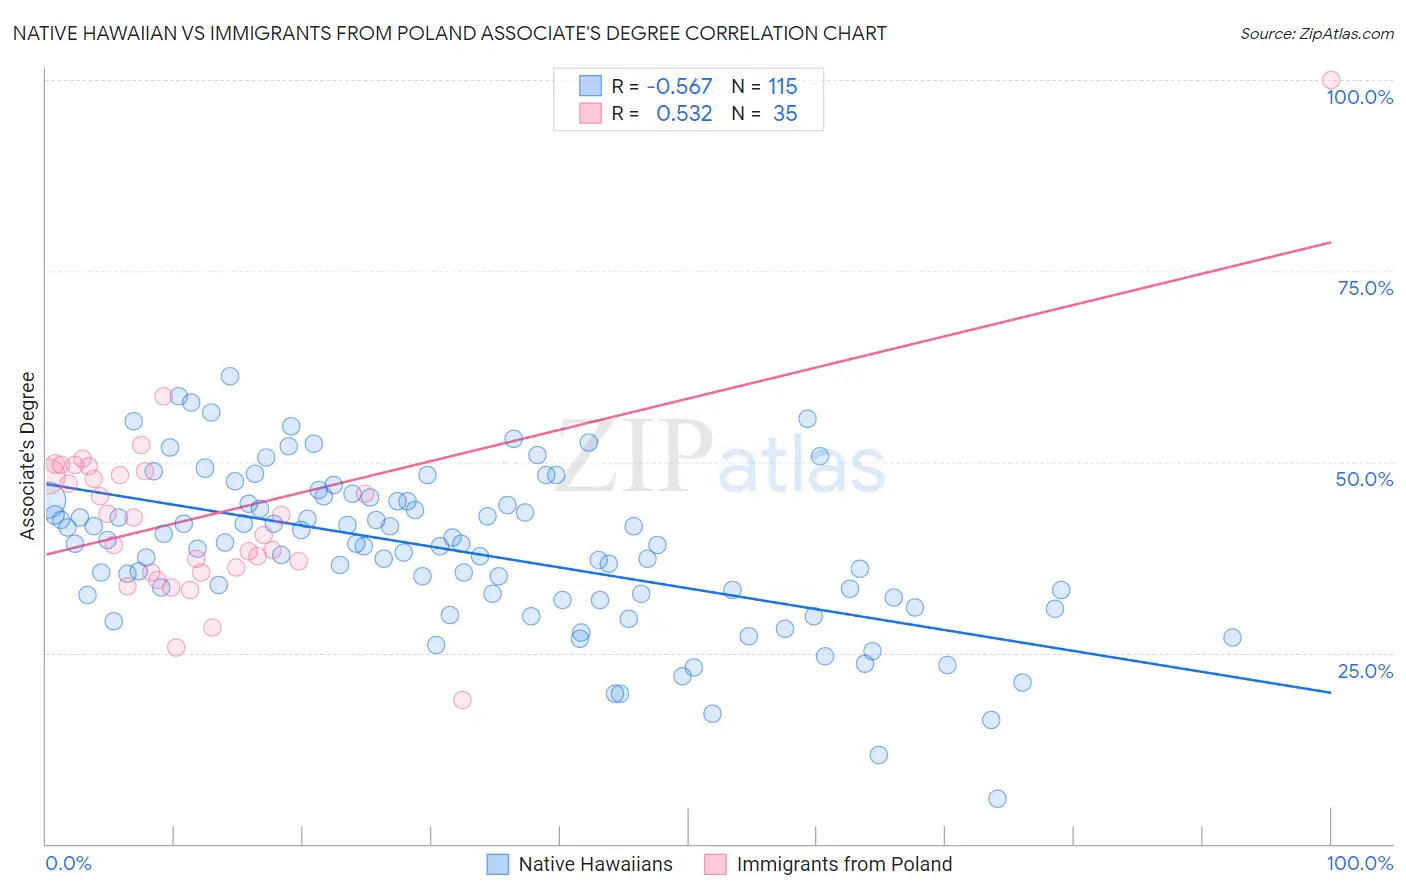
Native Hawaiian vs Immigrants from Poland Associate's Degree Correlation Chart
The statistical analysis conducted on geographies consisting of 332,098,475 people shows a substantial negative correlation between the proportion of Native Hawaiians and percentage of population with at least associate's degree education in the United States with a correlation coefficient (R) of -0.567 and weighted average of 43.1%. Similarly, the statistical analysis conducted on geographies consisting of 304,854,598 people shows a substantial positive correlation between the proportion of Immigrants from Poland and percentage of population with at least associate's degree education in the United States with a correlation coefficient (R) of 0.532 and weighted average of 47.1%, a difference of 9.1%.
Associate's Degree Correlation Summary
| Measurement | Native Hawaiian | Immigrants from Poland |
| Minimum | 5.9% | 18.8% |
| Maximum | 61.2% | 100.0% |
| Range | 55.3% | 81.2% |
| Mean | 38.4% | 42.9% |
| Median | 39.3% | 42.8% |
| Interquartile 25% (IQ1) | 32.3% | 35.5% |
| Interquartile 75% (IQ3) | 44.9% | 48.8% |
| Interquartile Range (IQR) | 12.6% | 13.2% |
| Standard Deviation (Sample) | 10.3% | 13.0% |
| Standard Deviation (Population) | 10.3% | 12.8% |
Similar Demographics by Associate's Degree
Demographics Similar to Native Hawaiians by Associate's Degree
In terms of associate's degree, the demographic groups most similar to Native Hawaiians are Tongan (43.0%, a difference of 0.16%), Tlingit-Haida (43.0%, a difference of 0.25%), Ecuadorian (43.0%, a difference of 0.35%), Immigrants from Barbados (43.3%, a difference of 0.43%), and Liberian (43.3%, a difference of 0.43%).
| Demographics | Rating | Rank | Associate's Degree |
| Guamanians/Chamorros | 4.8 /100 | #225 | Tragic 43.8% |
| Immigrants | Burma/Myanmar | 4.3 /100 | #226 | Tragic 43.7% |
| Trinidadians and Tobagonians | 4.0 /100 | #227 | Tragic 43.6% |
| Hmong | 3.2 /100 | #228 | Tragic 43.4% |
| Immigrants | Trinidad and Tobago | 3.0 /100 | #229 | Tragic 43.3% |
| Immigrants | Barbados | 2.9 /100 | #230 | Tragic 43.3% |
| Liberians | 2.9 /100 | #231 | Tragic 43.3% |
| Native Hawaiians | 2.3 /100 | #232 | Tragic 43.1% |
| Tongans | 2.2 /100 | #233 | Tragic 43.0% |
| Tlingit-Haida | 2.1 /100 | #234 | Tragic 43.0% |
| Ecuadorians | 2.0 /100 | #235 | Tragic 43.0% |
| Immigrants | St. Vincent and the Grenadines | 1.9 /100 | #236 | Tragic 42.9% |
| Immigrants | Nonimmigrants | 1.9 /100 | #237 | Tragic 42.9% |
| Iroquois | 1.7 /100 | #238 | Tragic 42.8% |
| Immigrants | Grenada | 1.3 /100 | #239 | Tragic 42.6% |
Demographics Similar to Immigrants from Poland by Associate's Degree
In terms of associate's degree, the demographic groups most similar to Immigrants from Poland are Immigrants from Germany (47.1%, a difference of 0.050%), Sudanese (47.1%, a difference of 0.090%), South American (47.1%, a difference of 0.12%), Kenyan (47.1%, a difference of 0.13%), and Immigrants from Kenya (47.2%, a difference of 0.26%).
| Demographics | Rating | Rank | Associate's Degree |
| Immigrants | Afghanistan | 74.3 /100 | #152 | Good 47.3% |
| Czechs | 72.2 /100 | #153 | Good 47.2% |
| Immigrants | Kenya | 72.1 /100 | #154 | Good 47.2% |
| Kenyans | 70.6 /100 | #155 | Good 47.1% |
| South Americans | 70.5 /100 | #156 | Good 47.1% |
| Sudanese | 70.3 /100 | #157 | Good 47.1% |
| Immigrants | Germany | 69.7 /100 | #158 | Good 47.1% |
| Immigrants | Poland | 69.2 /100 | #159 | Good 47.1% |
| Scottish | 65.4 /100 | #160 | Good 46.9% |
| Scandinavians | 65.2 /100 | #161 | Good 46.9% |
| Immigrants | Africa | 63.2 /100 | #162 | Good 46.8% |
| Somalis | 62.5 /100 | #163 | Good 46.8% |
| Colombians | 62.4 /100 | #164 | Good 46.8% |
| Immigrants | South America | 59.9 /100 | #165 | Average 46.7% |
| Hungarians | 59.3 /100 | #166 | Average 46.7% |