Native Hawaiian vs Immigrants from Albania Associate's Degree
COMPARE
Native Hawaiian
Immigrants from Albania
Associate's Degree
Associate's Degree Comparison
Native Hawaiians
Immigrants from Albania
43.1%
ASSOCIATE'S DEGREE
2.3/ 100
METRIC RATING
232nd/ 347
METRIC RANK
48.2%
ASSOCIATE'S DEGREE
89.9/ 100
METRIC RATING
132nd/ 347
METRIC RANK
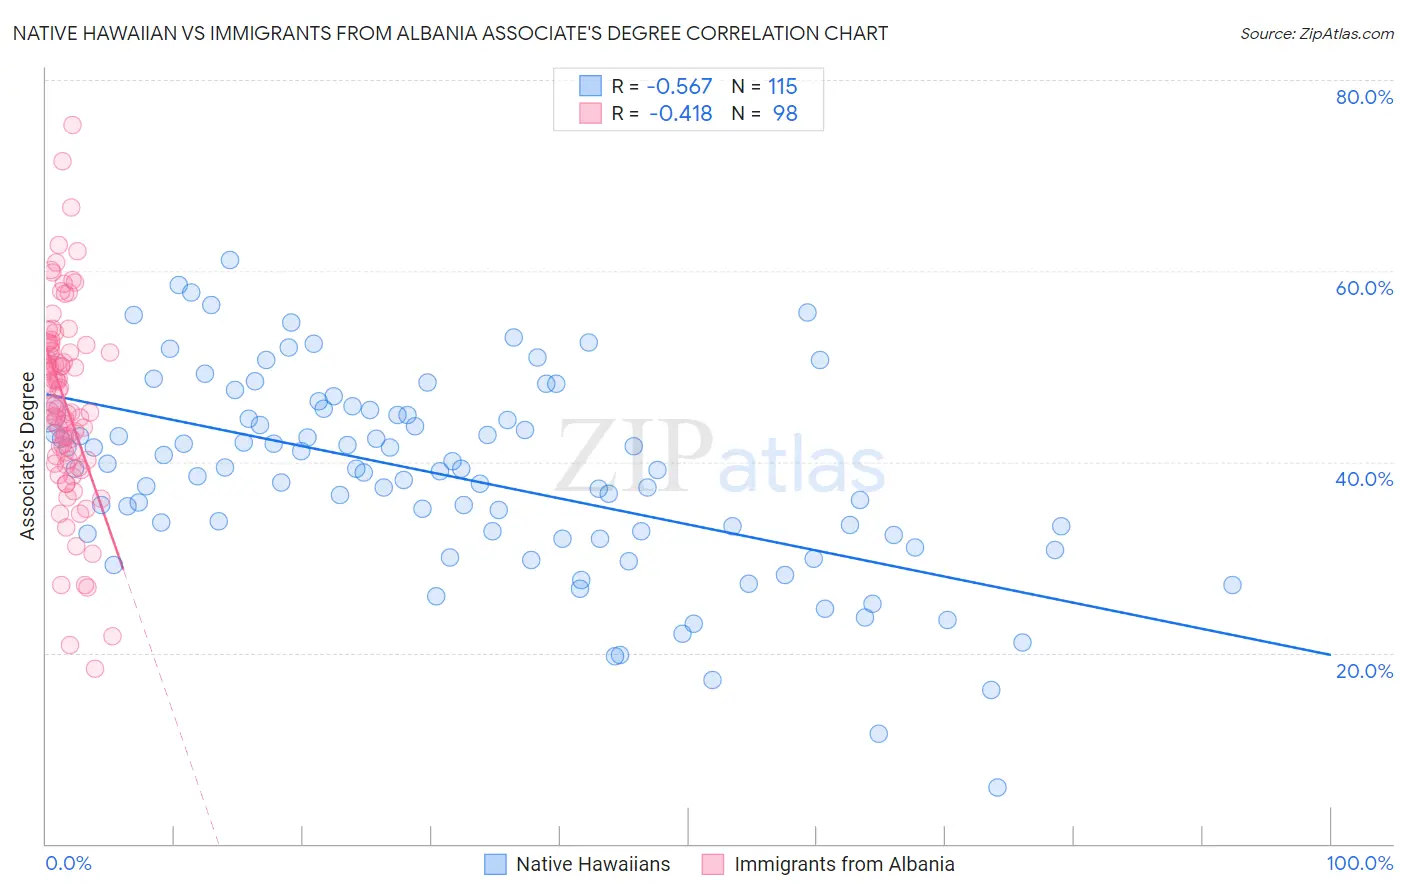
Native Hawaiian vs Immigrants from Albania Associate's Degree Correlation Chart
The statistical analysis conducted on geographies consisting of 332,098,475 people shows a substantial negative correlation between the proportion of Native Hawaiians and percentage of population with at least associate's degree education in the United States with a correlation coefficient (R) of -0.567 and weighted average of 43.1%. Similarly, the statistical analysis conducted on geographies consisting of 119,391,185 people shows a moderate negative correlation between the proportion of Immigrants from Albania and percentage of population with at least associate's degree education in the United States with a correlation coefficient (R) of -0.418 and weighted average of 48.2%, a difference of 11.9%.
Associate's Degree Correlation Summary
| Measurement | Native Hawaiian | Immigrants from Albania |
| Minimum | 5.9% | 18.3% |
| Maximum | 61.2% | 75.3% |
| Range | 55.3% | 57.0% |
| Mean | 38.4% | 46.2% |
| Median | 39.3% | 46.0% |
| Interquartile 25% (IQ1) | 32.3% | 40.3% |
| Interquartile 75% (IQ3) | 44.9% | 52.0% |
| Interquartile Range (IQR) | 12.6% | 11.7% |
| Standard Deviation (Sample) | 10.3% | 10.1% |
| Standard Deviation (Population) | 10.3% | 10.1% |
Similar Demographics by Associate's Degree
Demographics Similar to Native Hawaiians by Associate's Degree
In terms of associate's degree, the demographic groups most similar to Native Hawaiians are Tongan (43.0%, a difference of 0.16%), Tlingit-Haida (43.0%, a difference of 0.25%), Ecuadorian (43.0%, a difference of 0.35%), Immigrants from Barbados (43.3%, a difference of 0.43%), and Liberian (43.3%, a difference of 0.43%).
| Demographics | Rating | Rank | Associate's Degree |
| Guamanians/Chamorros | 4.8 /100 | #225 | Tragic 43.8% |
| Immigrants | Burma/Myanmar | 4.3 /100 | #226 | Tragic 43.7% |
| Trinidadians and Tobagonians | 4.0 /100 | #227 | Tragic 43.6% |
| Hmong | 3.2 /100 | #228 | Tragic 43.4% |
| Immigrants | Trinidad and Tobago | 3.0 /100 | #229 | Tragic 43.3% |
| Immigrants | Barbados | 2.9 /100 | #230 | Tragic 43.3% |
| Liberians | 2.9 /100 | #231 | Tragic 43.3% |
| Native Hawaiians | 2.3 /100 | #232 | Tragic 43.1% |
| Tongans | 2.2 /100 | #233 | Tragic 43.0% |
| Tlingit-Haida | 2.1 /100 | #234 | Tragic 43.0% |
| Ecuadorians | 2.0 /100 | #235 | Tragic 43.0% |
| Immigrants | St. Vincent and the Grenadines | 1.9 /100 | #236 | Tragic 42.9% |
| Immigrants | Nonimmigrants | 1.9 /100 | #237 | Tragic 42.9% |
| Iroquois | 1.7 /100 | #238 | Tragic 42.8% |
| Immigrants | Grenada | 1.3 /100 | #239 | Tragic 42.6% |
Demographics Similar to Immigrants from Albania by Associate's Degree
In terms of associate's degree, the demographic groups most similar to Immigrants from Albania are Assyrian/Chaldean/Syriac (48.2%, a difference of 0.080%), Moroccan (48.2%, a difference of 0.10%), European (48.2%, a difference of 0.16%), Icelander (48.3%, a difference of 0.18%), and Immigrants from Jordan (48.4%, a difference of 0.29%).
| Demographics | Rating | Rank | Associate's Degree |
| Chinese | 92.5 /100 | #125 | Exceptional 48.5% |
| Immigrants | Syria | 92.2 /100 | #126 | Exceptional 48.5% |
| Immigrants | Uganda | 92.1 /100 | #127 | Exceptional 48.5% |
| Immigrants | Eastern Africa | 91.6 /100 | #128 | Exceptional 48.4% |
| Swedes | 91.5 /100 | #129 | Exceptional 48.4% |
| Immigrants | Jordan | 91.2 /100 | #130 | Exceptional 48.4% |
| Icelanders | 90.8 /100 | #131 | Exceptional 48.3% |
| Immigrants | Albania | 89.9 /100 | #132 | Excellent 48.2% |
| Assyrians/Chaldeans/Syriacs | 89.4 /100 | #133 | Excellent 48.2% |
| Moroccans | 89.3 /100 | #134 | Excellent 48.2% |
| Europeans | 89.0 /100 | #135 | Excellent 48.2% |
| Pakistanis | 88.0 /100 | #136 | Excellent 48.1% |
| Immigrants | Eritrea | 87.8 /100 | #137 | Excellent 48.1% |
| Poles | 87.3 /100 | #138 | Excellent 48.0% |
| Slovenes | 85.1 /100 | #139 | Excellent 47.9% |