Ghanaian vs Immigrants from Poland Associate's Degree
COMPARE
Ghanaian
Immigrants from Poland
Associate's Degree
Associate's Degree Comparison
Ghanaians
Immigrants from Poland
45.8%
ASSOCIATE'S DEGREE
35.5/ 100
METRIC RATING
188th/ 347
METRIC RANK
47.1%
ASSOCIATE'S DEGREE
69.2/ 100
METRIC RATING
159th/ 347
METRIC RANK
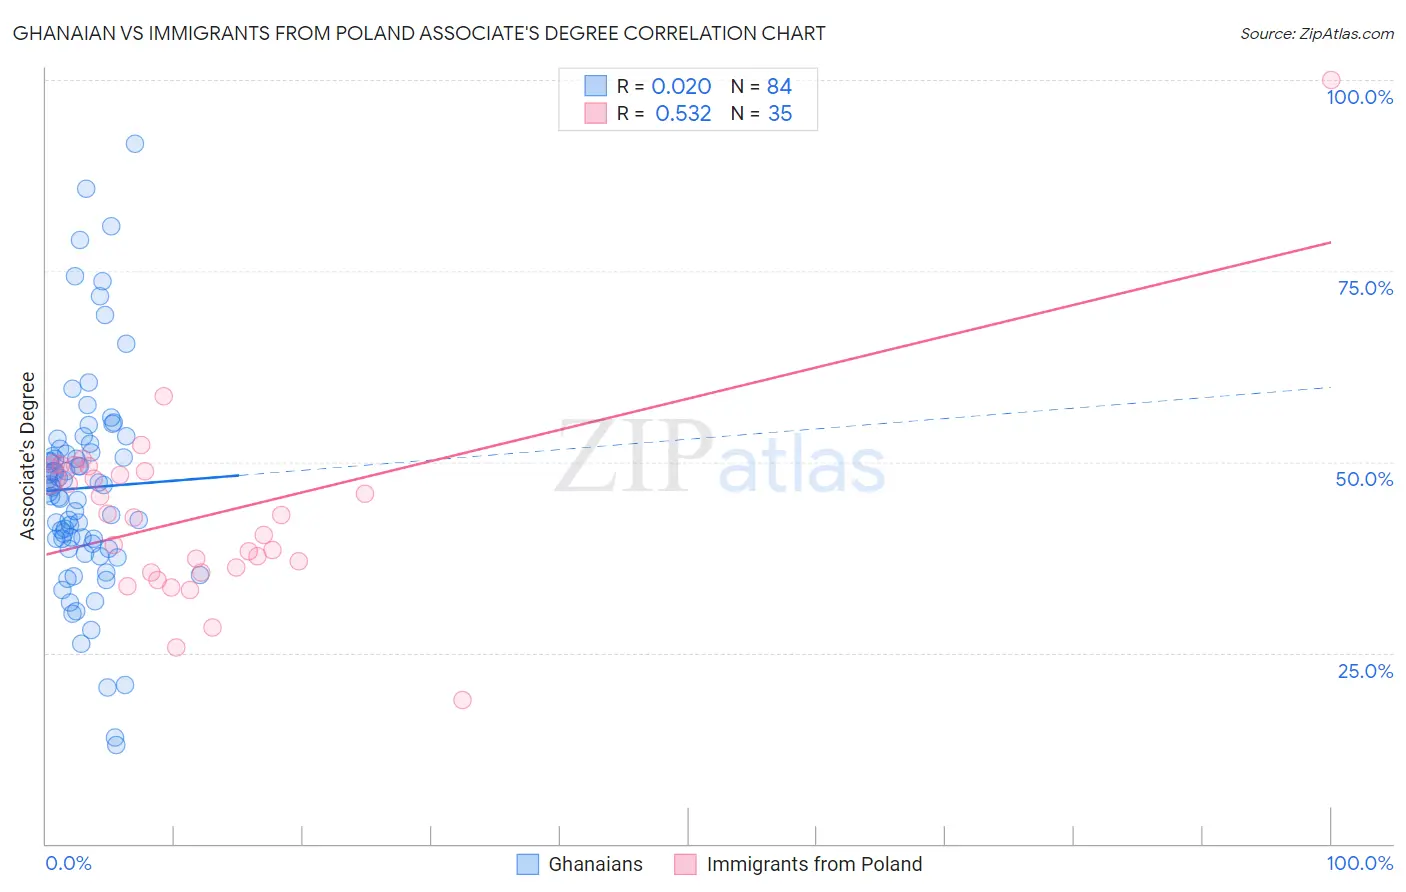
Ghanaian vs Immigrants from Poland Associate's Degree Correlation Chart
The statistical analysis conducted on geographies consisting of 190,686,281 people shows no correlation between the proportion of Ghanaians and percentage of population with at least associate's degree education in the United States with a correlation coefficient (R) of 0.020 and weighted average of 45.8%. Similarly, the statistical analysis conducted on geographies consisting of 304,854,598 people shows a substantial positive correlation between the proportion of Immigrants from Poland and percentage of population with at least associate's degree education in the United States with a correlation coefficient (R) of 0.532 and weighted average of 47.1%, a difference of 2.7%.
Associate's Degree Correlation Summary
| Measurement | Ghanaian | Immigrants from Poland |
| Minimum | 13.0% | 18.8% |
| Maximum | 91.7% | 100.0% |
| Range | 78.7% | 81.2% |
| Mean | 46.6% | 42.9% |
| Median | 46.4% | 42.8% |
| Interquartile 25% (IQ1) | 38.9% | 35.5% |
| Interquartile 75% (IQ3) | 51.4% | 48.8% |
| Interquartile Range (IQR) | 12.5% | 13.2% |
| Standard Deviation (Sample) | 14.3% | 13.0% |
| Standard Deviation (Population) | 14.2% | 12.8% |
Similar Demographics by Associate's Degree
Demographics Similar to Ghanaians by Associate's Degree
In terms of associate's degree, the demographic groups most similar to Ghanaians are Immigrants from Uruguay (45.8%, a difference of 0.0%), Immigrants from Oceania (45.8%, a difference of 0.060%), Vietnamese (45.8%, a difference of 0.12%), Korean (45.8%, a difference of 0.13%), and Celtic (45.8%, a difference of 0.18%).
| Demographics | Rating | Rank | Associate's Degree |
| Immigrants | Colombia | 41.3 /100 | #181 | Average 46.0% |
| Swiss | 40.4 /100 | #182 | Average 46.0% |
| Yugoslavians | 40.2 /100 | #183 | Average 46.0% |
| Czechoslovakians | 40.0 /100 | #184 | Average 46.0% |
| Costa Ricans | 38.6 /100 | #185 | Fair 46.0% |
| Welsh | 37.9 /100 | #186 | Fair 45.9% |
| Immigrants | Uruguay | 35.5 /100 | #187 | Fair 45.8% |
| Ghanaians | 35.5 /100 | #188 | Fair 45.8% |
| Immigrants | Oceania | 34.7 /100 | #189 | Fair 45.8% |
| Vietnamese | 34.0 /100 | #190 | Fair 45.8% |
| Koreans | 33.8 /100 | #191 | Fair 45.8% |
| Celtics | 33.3 /100 | #192 | Fair 45.8% |
| Immigrants | Cameroon | 31.0 /100 | #193 | Fair 45.7% |
| Immigrants | Peru | 27.6 /100 | #194 | Fair 45.5% |
| Germans | 26.5 /100 | #195 | Fair 45.5% |
Demographics Similar to Immigrants from Poland by Associate's Degree
In terms of associate's degree, the demographic groups most similar to Immigrants from Poland are Immigrants from Germany (47.1%, a difference of 0.050%), Sudanese (47.1%, a difference of 0.090%), South American (47.1%, a difference of 0.12%), Kenyan (47.1%, a difference of 0.13%), and Immigrants from Kenya (47.2%, a difference of 0.26%).
| Demographics | Rating | Rank | Associate's Degree |
| Immigrants | Afghanistan | 74.3 /100 | #152 | Good 47.3% |
| Czechs | 72.2 /100 | #153 | Good 47.2% |
| Immigrants | Kenya | 72.1 /100 | #154 | Good 47.2% |
| Kenyans | 70.6 /100 | #155 | Good 47.1% |
| South Americans | 70.5 /100 | #156 | Good 47.1% |
| Sudanese | 70.3 /100 | #157 | Good 47.1% |
| Immigrants | Germany | 69.7 /100 | #158 | Good 47.1% |
| Immigrants | Poland | 69.2 /100 | #159 | Good 47.1% |
| Scottish | 65.4 /100 | #160 | Good 46.9% |
| Scandinavians | 65.2 /100 | #161 | Good 46.9% |
| Immigrants | Africa | 63.2 /100 | #162 | Good 46.8% |
| Somalis | 62.5 /100 | #163 | Good 46.8% |
| Colombians | 62.4 /100 | #164 | Good 46.8% |
| Immigrants | South America | 59.9 /100 | #165 | Average 46.7% |
| Hungarians | 59.3 /100 | #166 | Average 46.7% |