Menominee vs Sri Lankan Bachelor's Degree
COMPARE
Menominee
Sri Lankan
Bachelor's Degree
Bachelor's Degree Comparison
Menominee
Sri Lankans
27.3%
BACHELOR'S DEGREE
0.0/ 100
METRIC RATING
332nd/ 347
METRIC RANK
38.2%
BACHELOR'S DEGREE
59.1/ 100
METRIC RATING
165th/ 347
METRIC RANK
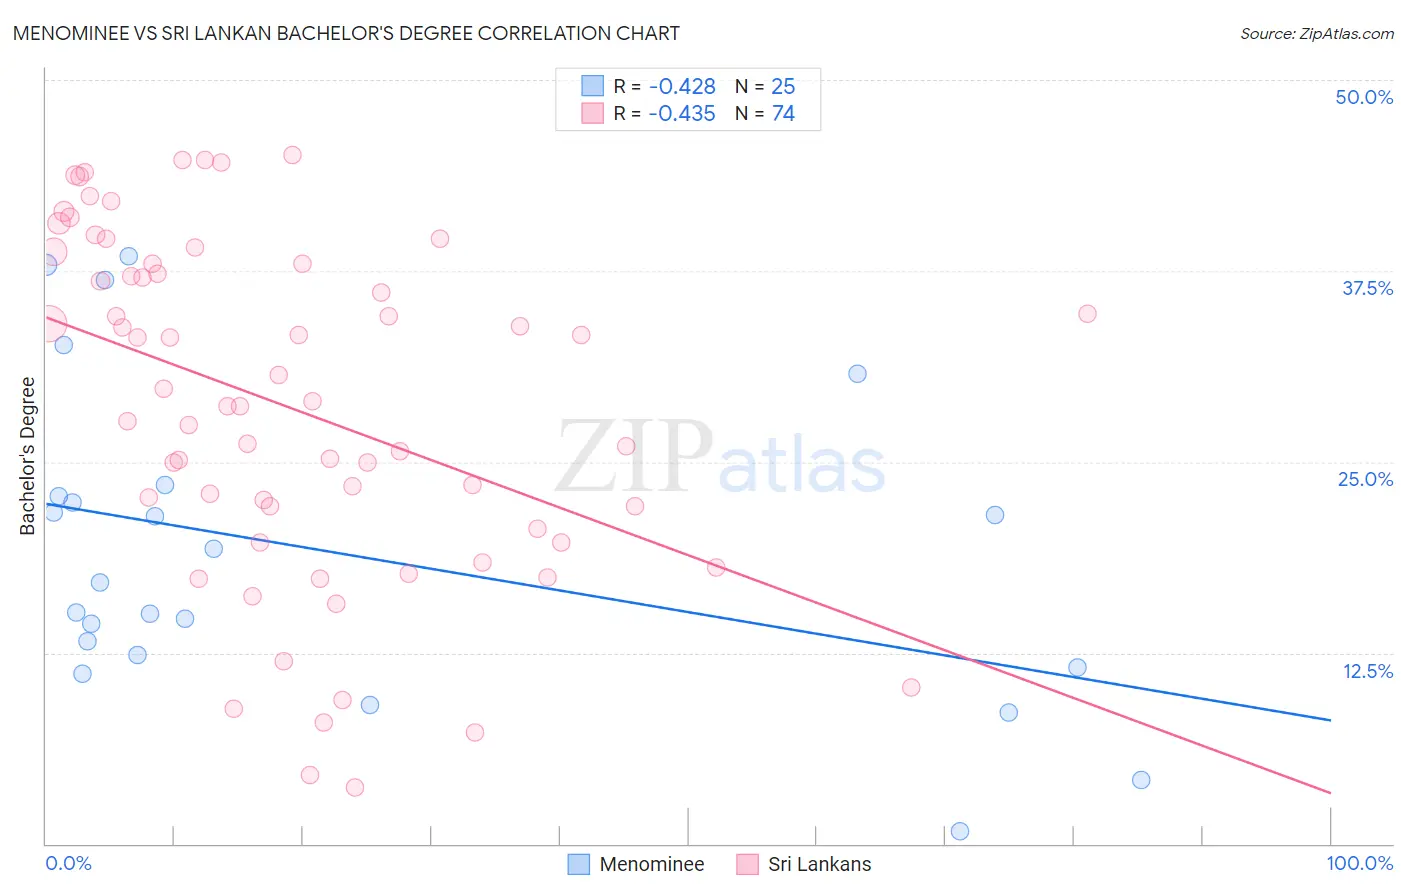
Menominee vs Sri Lankan Bachelor's Degree Correlation Chart
The statistical analysis conducted on geographies consisting of 45,778,829 people shows a moderate negative correlation between the proportion of Menominee and percentage of population with at least bachelor's degree education in the United States with a correlation coefficient (R) of -0.428 and weighted average of 27.3%. Similarly, the statistical analysis conducted on geographies consisting of 440,520,330 people shows a moderate negative correlation between the proportion of Sri Lankans and percentage of population with at least bachelor's degree education in the United States with a correlation coefficient (R) of -0.435 and weighted average of 38.2%, a difference of 39.8%.
Bachelor's Degree Correlation Summary
| Measurement | Menominee | Sri Lankan |
| Minimum | 0.82% | 3.7% |
| Maximum | 38.4% | 45.1% |
| Range | 37.6% | 41.4% |
| Mean | 19.1% | 28.6% |
| Median | 17.1% | 28.8% |
| Interquartile 25% (IQ1) | 12.0% | 20.6% |
| Interquartile 75% (IQ3) | 23.1% | 37.9% |
| Interquartile Range (IQR) | 11.2% | 17.3% |
| Standard Deviation (Sample) | 10.1% | 11.1% |
| Standard Deviation (Population) | 9.9% | 11.0% |
Similar Demographics by Bachelor's Degree
Demographics Similar to Menominee by Bachelor's Degree
In terms of bachelor's degree, the demographic groups most similar to Menominee are Immigrants from the Azores (27.3%, a difference of 0.10%), Spanish American Indian (27.5%, a difference of 0.58%), Immigrants from Central America (27.5%, a difference of 0.64%), Mexican (27.1%, a difference of 0.82%), and Crow (27.7%, a difference of 1.7%).
| Demographics | Rating | Rank | Bachelor's Degree |
| Pennsylvania Germans | 0.0 /100 | #325 | Tragic 28.4% |
| Apache | 0.0 /100 | #326 | Tragic 28.3% |
| Paiute | 0.0 /100 | #327 | Tragic 28.1% |
| Crow | 0.0 /100 | #328 | Tragic 27.7% |
| Immigrants | Central America | 0.0 /100 | #329 | Tragic 27.5% |
| Spanish American Indians | 0.0 /100 | #330 | Tragic 27.5% |
| Immigrants | Azores | 0.0 /100 | #331 | Tragic 27.3% |
| Menominee | 0.0 /100 | #332 | Tragic 27.3% |
| Mexicans | 0.0 /100 | #333 | Tragic 27.1% |
| Arapaho | 0.0 /100 | #334 | Tragic 26.6% |
| Natives/Alaskans | 0.0 /100 | #335 | Tragic 26.3% |
| Immigrants | Mexico | 0.0 /100 | #336 | Tragic 26.1% |
| Inupiat | 0.0 /100 | #337 | Tragic 25.8% |
| Pueblo | 0.0 /100 | #338 | Tragic 25.5% |
| Hopi | 0.0 /100 | #339 | Tragic 25.3% |
Demographics Similar to Sri Lankans by Bachelor's Degree
In terms of bachelor's degree, the demographic groups most similar to Sri Lankans are Somali (38.1%, a difference of 0.050%), Scottish (38.1%, a difference of 0.25%), Danish (38.1%, a difference of 0.29%), Hungarian (38.3%, a difference of 0.30%), and Ghanaian (38.0%, a difference of 0.37%).
| Demographics | Rating | Rank | Bachelor's Degree |
| Immigrants | Germany | 69.6 /100 | #158 | Good 38.6% |
| Chinese | 66.6 /100 | #159 | Good 38.5% |
| Vietnamese | 66.6 /100 | #160 | Good 38.5% |
| Uruguayans | 65.8 /100 | #161 | Good 38.4% |
| Colombians | 65.0 /100 | #162 | Good 38.4% |
| Peruvians | 63.4 /100 | #163 | Good 38.3% |
| Hungarians | 62.1 /100 | #164 | Good 38.3% |
| Sri Lankans | 59.1 /100 | #165 | Average 38.2% |
| Somalis | 58.6 /100 | #166 | Average 38.1% |
| Scottish | 56.6 /100 | #167 | Average 38.1% |
| Danes | 56.2 /100 | #168 | Average 38.1% |
| Ghanaians | 55.3 /100 | #169 | Average 38.0% |
| Czechs | 54.4 /100 | #170 | Average 38.0% |
| Bermudans | 54.2 /100 | #171 | Average 38.0% |
| Immigrants | Somalia | 52.8 /100 | #172 | Average 37.9% |