Immigrants from Hong Kong vs Sri Lankan Bachelor's Degree
COMPARE
Immigrants from Hong Kong
Sri Lankan
Bachelor's Degree
Bachelor's Degree Comparison
Immigrants from Hong Kong
Sri Lankans
48.2%
BACHELOR'S DEGREE
100.0/ 100
METRIC RATING
14th/ 347
METRIC RANK
38.2%
BACHELOR'S DEGREE
59.1/ 100
METRIC RATING
165th/ 347
METRIC RANK
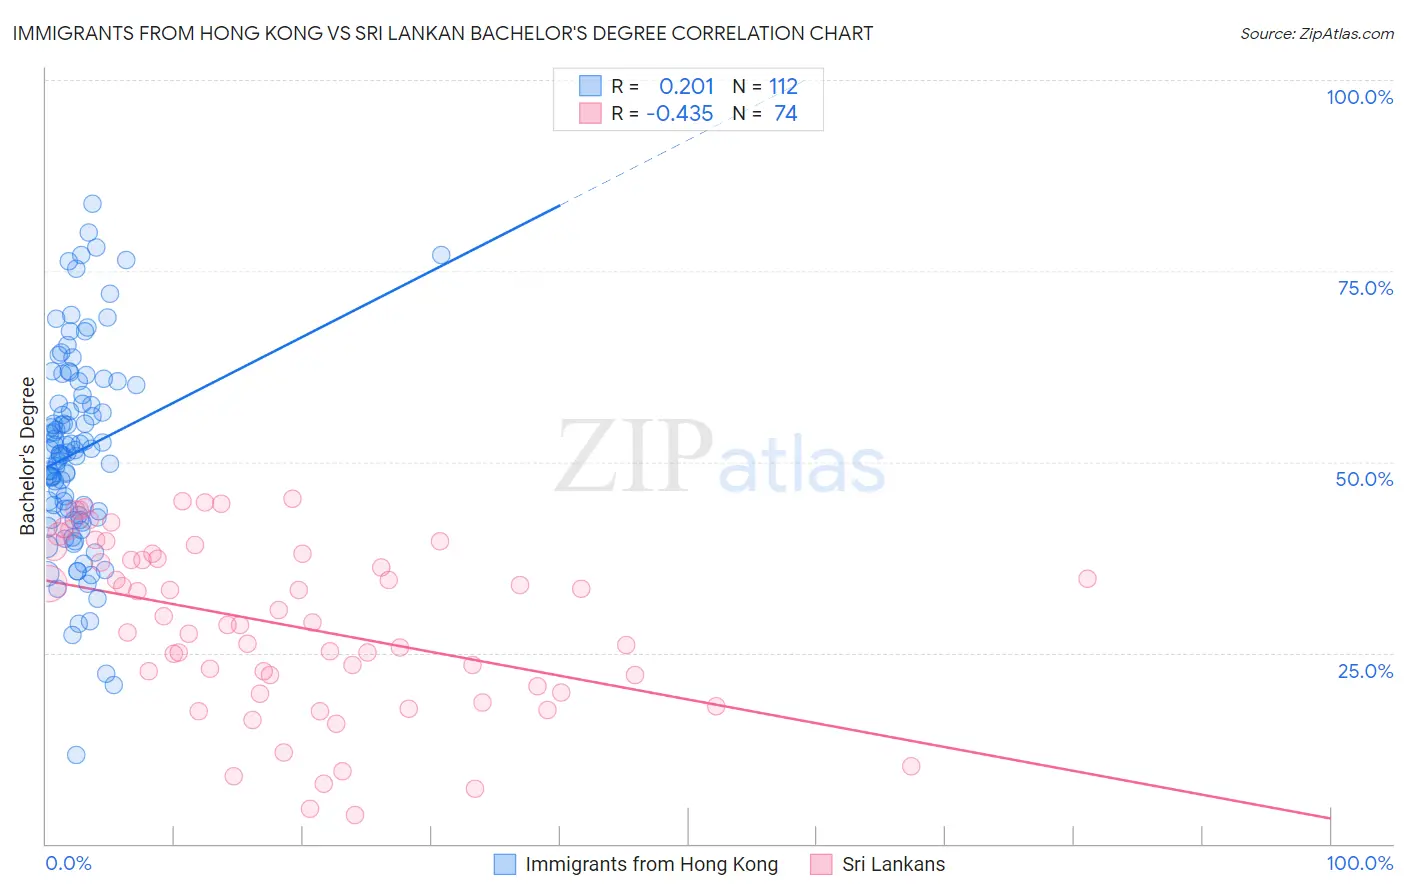
Immigrants from Hong Kong vs Sri Lankan Bachelor's Degree Correlation Chart
The statistical analysis conducted on geographies consisting of 253,986,152 people shows a weak positive correlation between the proportion of Immigrants from Hong Kong and percentage of population with at least bachelor's degree education in the United States with a correlation coefficient (R) of 0.201 and weighted average of 48.2%. Similarly, the statistical analysis conducted on geographies consisting of 440,520,330 people shows a moderate negative correlation between the proportion of Sri Lankans and percentage of population with at least bachelor's degree education in the United States with a correlation coefficient (R) of -0.435 and weighted average of 38.2%, a difference of 26.3%.
Bachelor's Degree Correlation Summary
| Measurement | Immigrants from Hong Kong | Sri Lankan |
| Minimum | 11.7% | 3.7% |
| Maximum | 83.9% | 45.1% |
| Range | 72.2% | 41.4% |
| Mean | 51.3% | 28.6% |
| Median | 51.2% | 28.8% |
| Interquartile 25% (IQ1) | 42.9% | 20.6% |
| Interquartile 75% (IQ3) | 59.4% | 37.9% |
| Interquartile Range (IQR) | 16.5% | 17.3% |
| Standard Deviation (Sample) | 13.2% | 11.1% |
| Standard Deviation (Population) | 13.1% | 11.0% |
Similar Demographics by Bachelor's Degree
Demographics Similar to Immigrants from Hong Kong by Bachelor's Degree
In terms of bachelor's degree, the demographic groups most similar to Immigrants from Hong Kong are Immigrants from Eastern Asia (48.1%, a difference of 0.14%), Immigrants from South Central Asia (48.3%, a difference of 0.28%), Immigrants from China (48.4%, a difference of 0.42%), Immigrants from Australia (48.5%, a difference of 0.60%), and Soviet Union (47.9%, a difference of 0.60%).
| Demographics | Rating | Rank | Bachelor's Degree |
| Immigrants | Iran | 100.0 /100 | #7 | Exceptional 50.3% |
| Thais | 100.0 /100 | #8 | Exceptional 50.1% |
| Immigrants | Israel | 100.0 /100 | #9 | Exceptional 50.0% |
| Cypriots | 100.0 /100 | #10 | Exceptional 49.0% |
| Immigrants | Australia | 100.0 /100 | #11 | Exceptional 48.5% |
| Immigrants | China | 100.0 /100 | #12 | Exceptional 48.4% |
| Immigrants | South Central Asia | 100.0 /100 | #13 | Exceptional 48.3% |
| Immigrants | Hong Kong | 100.0 /100 | #14 | Exceptional 48.2% |
| Immigrants | Eastern Asia | 100.0 /100 | #15 | Exceptional 48.1% |
| Soviet Union | 100.0 /100 | #16 | Exceptional 47.9% |
| Eastern Europeans | 100.0 /100 | #17 | Exceptional 47.5% |
| Indians (Asian) | 100.0 /100 | #18 | Exceptional 47.4% |
| Cambodians | 100.0 /100 | #19 | Exceptional 47.2% |
| Immigrants | Switzerland | 100.0 /100 | #20 | Exceptional 47.1% |
| Immigrants | Ireland | 100.0 /100 | #21 | Exceptional 47.1% |
Demographics Similar to Sri Lankans by Bachelor's Degree
In terms of bachelor's degree, the demographic groups most similar to Sri Lankans are Somali (38.1%, a difference of 0.050%), Scottish (38.1%, a difference of 0.25%), Danish (38.1%, a difference of 0.29%), Hungarian (38.3%, a difference of 0.30%), and Ghanaian (38.0%, a difference of 0.37%).
| Demographics | Rating | Rank | Bachelor's Degree |
| Immigrants | Germany | 69.6 /100 | #158 | Good 38.6% |
| Chinese | 66.6 /100 | #159 | Good 38.5% |
| Vietnamese | 66.6 /100 | #160 | Good 38.5% |
| Uruguayans | 65.8 /100 | #161 | Good 38.4% |
| Colombians | 65.0 /100 | #162 | Good 38.4% |
| Peruvians | 63.4 /100 | #163 | Good 38.3% |
| Hungarians | 62.1 /100 | #164 | Good 38.3% |
| Sri Lankans | 59.1 /100 | #165 | Average 38.2% |
| Somalis | 58.6 /100 | #166 | Average 38.1% |
| Scottish | 56.6 /100 | #167 | Average 38.1% |
| Danes | 56.2 /100 | #168 | Average 38.1% |
| Ghanaians | 55.3 /100 | #169 | Average 38.0% |
| Czechs | 54.4 /100 | #170 | Average 38.0% |
| Bermudans | 54.2 /100 | #171 | Average 38.0% |
| Immigrants | Somalia | 52.8 /100 | #172 | Average 37.9% |