Immigrants from Nepal vs Sri Lankan Bachelor's Degree
COMPARE
Immigrants from Nepal
Sri Lankan
Bachelor's Degree
Bachelor's Degree Comparison
Immigrants from Nepal
Sri Lankans
41.7%
BACHELOR'S DEGREE
98.6/ 100
METRIC RATING
94th/ 347
METRIC RANK
38.2%
BACHELOR'S DEGREE
59.1/ 100
METRIC RATING
165th/ 347
METRIC RANK
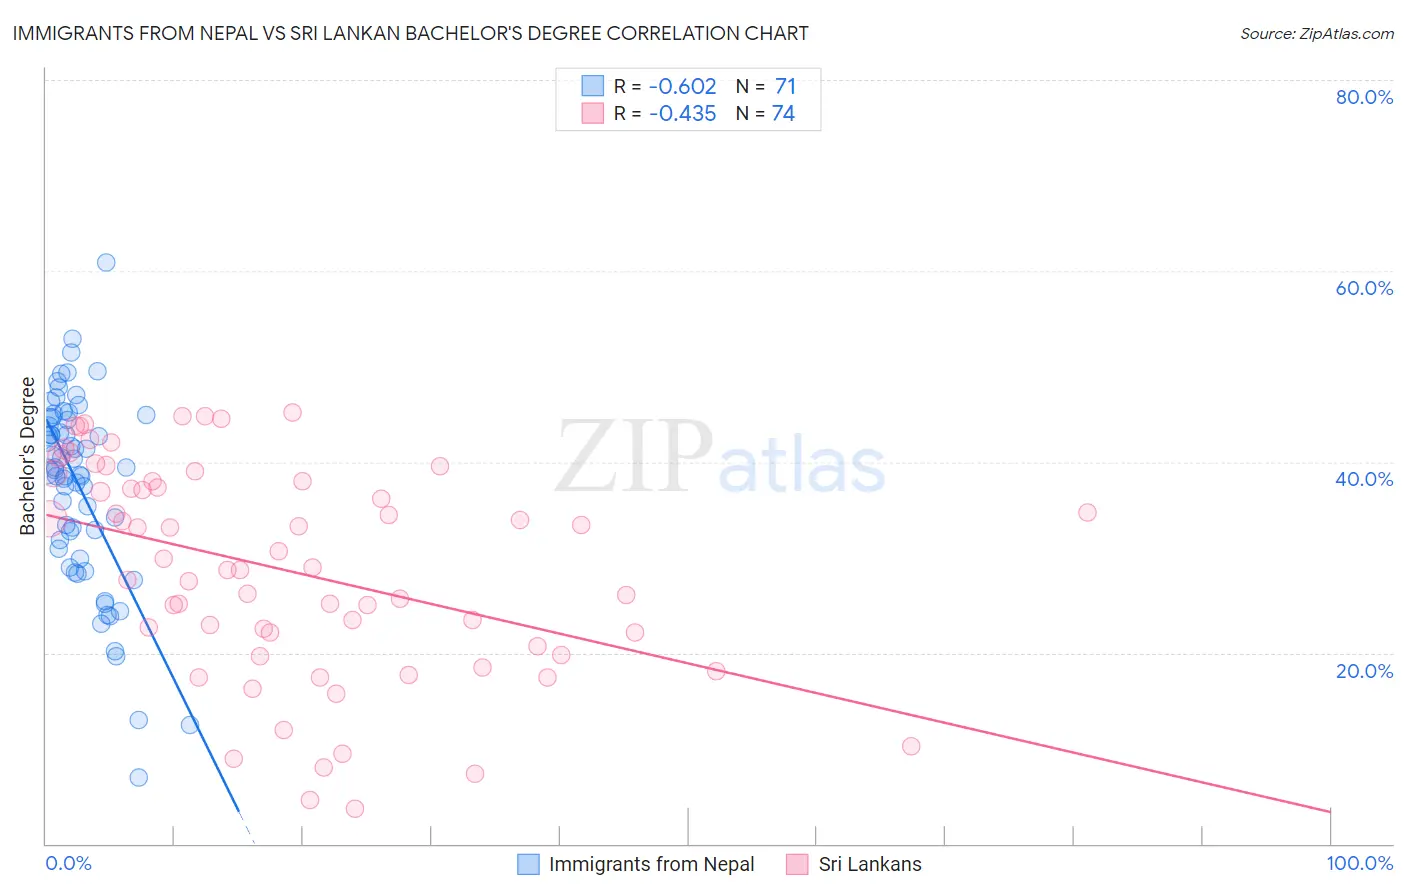
Immigrants from Nepal vs Sri Lankan Bachelor's Degree Correlation Chart
The statistical analysis conducted on geographies consisting of 186,767,896 people shows a significant negative correlation between the proportion of Immigrants from Nepal and percentage of population with at least bachelor's degree education in the United States with a correlation coefficient (R) of -0.602 and weighted average of 41.7%. Similarly, the statistical analysis conducted on geographies consisting of 440,520,330 people shows a moderate negative correlation between the proportion of Sri Lankans and percentage of population with at least bachelor's degree education in the United States with a correlation coefficient (R) of -0.435 and weighted average of 38.2%, a difference of 9.3%.
Bachelor's Degree Correlation Summary
| Measurement | Immigrants from Nepal | Sri Lankan |
| Minimum | 7.0% | 3.7% |
| Maximum | 60.9% | 45.1% |
| Range | 53.9% | 41.4% |
| Mean | 37.3% | 28.6% |
| Median | 39.2% | 28.8% |
| Interquartile 25% (IQ1) | 30.9% | 20.6% |
| Interquartile 75% (IQ3) | 44.6% | 37.9% |
| Interquartile Range (IQR) | 13.7% | 17.3% |
| Standard Deviation (Sample) | 10.1% | 11.1% |
| Standard Deviation (Population) | 10.0% | 11.0% |
Similar Demographics by Bachelor's Degree
Demographics Similar to Immigrants from Nepal by Bachelor's Degree
In terms of bachelor's degree, the demographic groups most similar to Immigrants from Nepal are Immigrants from Canada (41.7%, a difference of 0.020%), Immigrants from North America (41.7%, a difference of 0.12%), Immigrants from Moldova (41.6%, a difference of 0.23%), Romanian (41.6%, a difference of 0.29%), and Immigrants from Ukraine (41.5%, a difference of 0.40%).
| Demographics | Rating | Rank | Bachelor's Degree |
| Carpatho Rusyns | 99.0 /100 | #87 | Exceptional 42.1% |
| Immigrants | Western Europe | 99.0 /100 | #88 | Exceptional 42.0% |
| Greeks | 99.0 /100 | #89 | Exceptional 42.0% |
| Laotians | 98.9 /100 | #90 | Exceptional 42.0% |
| Immigrants | Northern Africa | 98.9 /100 | #91 | Exceptional 41.9% |
| Maltese | 98.8 /100 | #92 | Exceptional 41.9% |
| Immigrants | Canada | 98.6 /100 | #93 | Exceptional 41.7% |
| Immigrants | Nepal | 98.6 /100 | #94 | Exceptional 41.7% |
| Immigrants | North America | 98.5 /100 | #95 | Exceptional 41.7% |
| Immigrants | Moldova | 98.4 /100 | #96 | Exceptional 41.6% |
| Romanians | 98.4 /100 | #97 | Exceptional 41.6% |
| Immigrants | Ukraine | 98.3 /100 | #98 | Exceptional 41.5% |
| Immigrants | England | 98.1 /100 | #99 | Exceptional 41.4% |
| Macedonians | 98.1 /100 | #100 | Exceptional 41.4% |
| Immigrants | Morocco | 98.0 /100 | #101 | Exceptional 41.4% |
Demographics Similar to Sri Lankans by Bachelor's Degree
In terms of bachelor's degree, the demographic groups most similar to Sri Lankans are Somali (38.1%, a difference of 0.050%), Scottish (38.1%, a difference of 0.25%), Danish (38.1%, a difference of 0.29%), Hungarian (38.3%, a difference of 0.30%), and Ghanaian (38.0%, a difference of 0.37%).
| Demographics | Rating | Rank | Bachelor's Degree |
| Immigrants | Germany | 69.6 /100 | #158 | Good 38.6% |
| Chinese | 66.6 /100 | #159 | Good 38.5% |
| Vietnamese | 66.6 /100 | #160 | Good 38.5% |
| Uruguayans | 65.8 /100 | #161 | Good 38.4% |
| Colombians | 65.0 /100 | #162 | Good 38.4% |
| Peruvians | 63.4 /100 | #163 | Good 38.3% |
| Hungarians | 62.1 /100 | #164 | Good 38.3% |
| Sri Lankans | 59.1 /100 | #165 | Average 38.2% |
| Somalis | 58.6 /100 | #166 | Average 38.1% |
| Scottish | 56.6 /100 | #167 | Average 38.1% |
| Danes | 56.2 /100 | #168 | Average 38.1% |
| Ghanaians | 55.3 /100 | #169 | Average 38.0% |
| Czechs | 54.4 /100 | #170 | Average 38.0% |
| Bermudans | 54.2 /100 | #171 | Average 38.0% |
| Immigrants | Somalia | 52.8 /100 | #172 | Average 37.9% |