Menominee vs Immigrants from Philippines Doctorate Degree
COMPARE
Menominee
Immigrants from Philippines
Doctorate Degree
Doctorate Degree Comparison
Menominee
Immigrants from Philippines
1.4%
DOCTORATE DEGREE
0.1/ 100
METRIC RATING
313th/ 347
METRIC RANK
1.6%
DOCTORATE DEGREE
4.3/ 100
METRIC RATING
230th/ 347
METRIC RANK
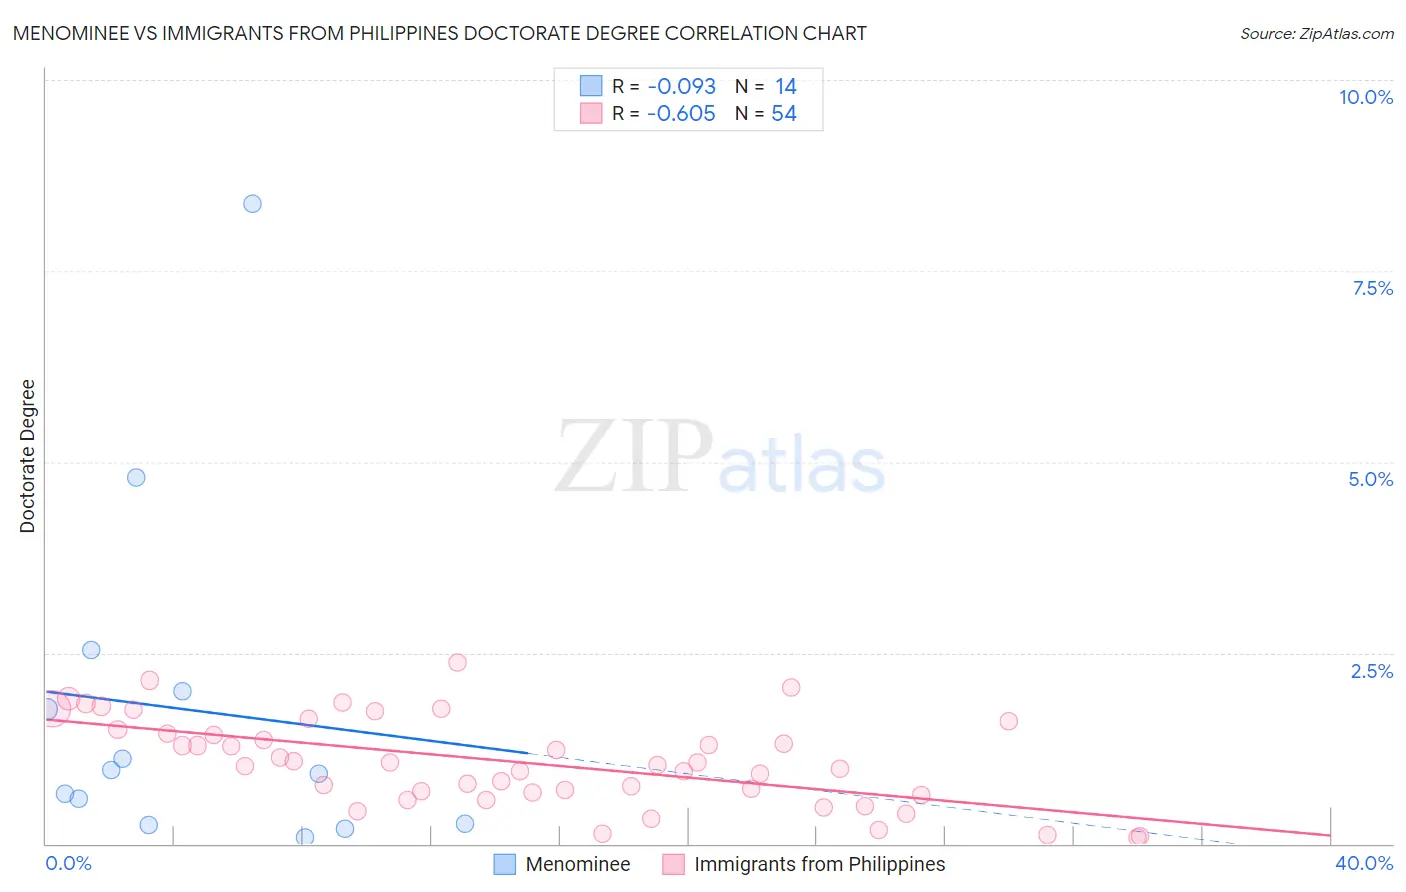
Menominee vs Immigrants from Philippines Doctorate Degree Correlation Chart
The statistical analysis conducted on geographies consisting of 45,550,616 people shows a slight negative correlation between the proportion of Menominee and percentage of population with at least doctorate degree education in the United States with a correlation coefficient (R) of -0.093 and weighted average of 1.4%. Similarly, the statistical analysis conducted on geographies consisting of 464,152,098 people shows a significant negative correlation between the proportion of Immigrants from Philippines and percentage of population with at least doctorate degree education in the United States with a correlation coefficient (R) of -0.605 and weighted average of 1.6%, a difference of 20.3%.
Doctorate Degree Correlation Summary
| Measurement | Menominee | Immigrants from Philippines |
| Minimum | 0.087% | 0.076% |
| Maximum | 8.4% | 2.4% |
| Range | 8.3% | 2.3% |
| Mean | 1.8% | 1.1% |
| Median | 0.94% | 1.0% |
| Interquartile 25% (IQ1) | 0.26% | 0.68% |
| Interquartile 75% (IQ3) | 2.0% | 1.5% |
| Interquartile Range (IQR) | 1.7% | 0.81% |
| Standard Deviation (Sample) | 2.3% | 0.58% |
| Standard Deviation (Population) | 2.2% | 0.57% |
Similar Demographics by Doctorate Degree
Demographics Similar to Menominee by Doctorate Degree
In terms of doctorate degree, the demographic groups most similar to Menominee are Dominican (1.4%, a difference of 0.080%), Immigrants from the Azores (1.4%, a difference of 0.10%), Navajo (1.4%, a difference of 0.31%), Immigrants from Nicaragua (1.4%, a difference of 0.32%), and Immigrants from Micronesia (1.3%, a difference of 0.55%).
| Demographics | Rating | Rank | Doctorate Degree |
| Guyanese | 0.1 /100 | #306 | Tragic 1.4% |
| Cubans | 0.1 /100 | #307 | Tragic 1.4% |
| Immigrants | Laos | 0.1 /100 | #308 | Tragic 1.4% |
| Immigrants | Grenada | 0.1 /100 | #309 | Tragic 1.4% |
| Immigrants | Jamaica | 0.1 /100 | #310 | Tragic 1.4% |
| Immigrants | Honduras | 0.1 /100 | #311 | Tragic 1.4% |
| Immigrants | Nicaragua | 0.1 /100 | #312 | Tragic 1.4% |
| Menominee | 0.1 /100 | #313 | Tragic 1.4% |
| Dominicans | 0.1 /100 | #314 | Tragic 1.4% |
| Immigrants | Azores | 0.1 /100 | #315 | Tragic 1.4% |
| Navajo | 0.1 /100 | #316 | Tragic 1.4% |
| Immigrants | Micronesia | 0.1 /100 | #317 | Tragic 1.3% |
| Creek | 0.1 /100 | #318 | Tragic 1.3% |
| Immigrants | Guyana | 0.1 /100 | #319 | Tragic 1.3% |
| Immigrants | St. Vincent and the Grenadines | 0.1 /100 | #320 | Tragic 1.3% |
Demographics Similar to Immigrants from Philippines by Doctorate Degree
In terms of doctorate degree, the demographic groups most similar to Immigrants from Philippines are Colville (1.6%, a difference of 0.31%), Immigrants from North Macedonia (1.6%, a difference of 0.47%), Guamanian/Chamorro (1.6%, a difference of 1.2%), Barbadian (1.6%, a difference of 1.2%), and Assyrian/Chaldean/Syriac (1.7%, a difference of 1.3%).
| Demographics | Rating | Rank | Doctorate Degree |
| Immigrants | Bosnia and Herzegovina | 7.8 /100 | #223 | Tragic 1.7% |
| Immigrants | Poland | 7.4 /100 | #224 | Tragic 1.7% |
| Immigrants | Colombia | 6.7 /100 | #225 | Tragic 1.7% |
| Osage | 6.5 /100 | #226 | Tragic 1.7% |
| Panamanians | 6.3 /100 | #227 | Tragic 1.7% |
| Assyrians/Chaldeans/Syriacs | 5.9 /100 | #228 | Tragic 1.7% |
| Colville | 4.7 /100 | #229 | Tragic 1.6% |
| Immigrants | Philippines | 4.3 /100 | #230 | Tragic 1.6% |
| Immigrants | North Macedonia | 3.9 /100 | #231 | Tragic 1.6% |
| Guamanians/Chamorros | 3.3 /100 | #232 | Tragic 1.6% |
| Barbadians | 3.3 /100 | #233 | Tragic 1.6% |
| Hopi | 3.2 /100 | #234 | Tragic 1.6% |
| Cree | 3.0 /100 | #235 | Tragic 1.6% |
| Indonesians | 2.8 /100 | #236 | Tragic 1.6% |
| Iroquois | 2.7 /100 | #237 | Tragic 1.6% |