Asian vs Immigrants from Philippines Doctorate Degree
COMPARE
Asian
Immigrants from Philippines
Doctorate Degree
Doctorate Degree Comparison
Asians
Immigrants from Philippines
2.4%
DOCTORATE DEGREE
100.0/ 100
METRIC RATING
48th/ 347
METRIC RANK
1.6%
DOCTORATE DEGREE
4.3/ 100
METRIC RATING
230th/ 347
METRIC RANK
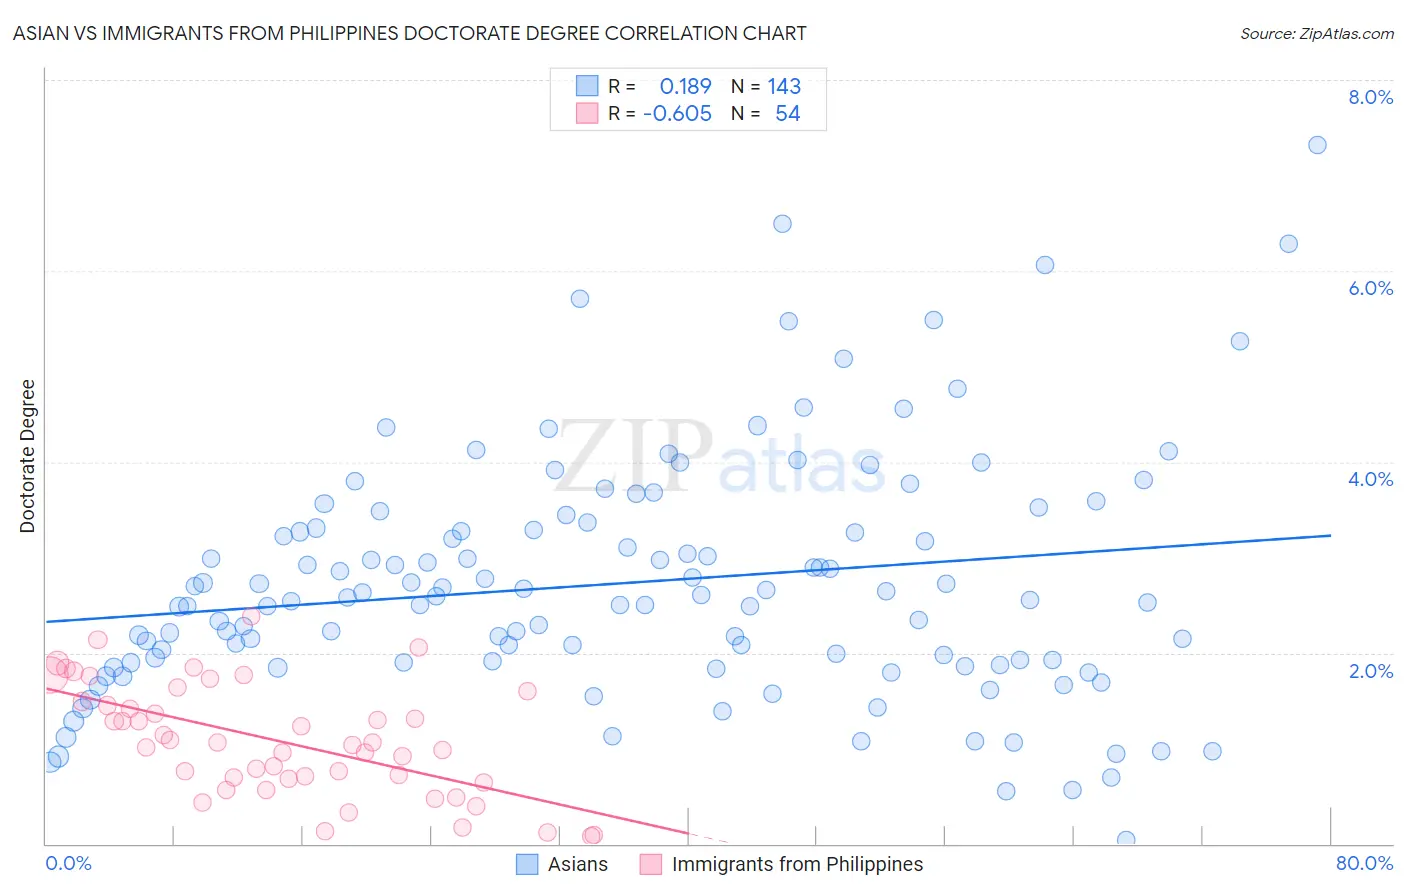
Asian vs Immigrants from Philippines Doctorate Degree Correlation Chart
The statistical analysis conducted on geographies consisting of 534,469,334 people shows a poor positive correlation between the proportion of Asians and percentage of population with at least doctorate degree education in the United States with a correlation coefficient (R) of 0.189 and weighted average of 2.4%. Similarly, the statistical analysis conducted on geographies consisting of 464,152,098 people shows a significant negative correlation between the proportion of Immigrants from Philippines and percentage of population with at least doctorate degree education in the United States with a correlation coefficient (R) of -0.605 and weighted average of 1.6%, a difference of 49.0%.
Doctorate Degree Correlation Summary
| Measurement | Asian | Immigrants from Philippines |
| Minimum | 0.043% | 0.076% |
| Maximum | 7.3% | 2.4% |
| Range | 7.3% | 2.3% |
| Mean | 2.7% | 1.1% |
| Median | 2.6% | 1.0% |
| Interquartile 25% (IQ1) | 1.9% | 0.68% |
| Interquartile 75% (IQ3) | 3.3% | 1.5% |
| Interquartile Range (IQR) | 1.4% | 0.81% |
| Standard Deviation (Sample) | 1.3% | 0.58% |
| Standard Deviation (Population) | 1.3% | 0.57% |
Similar Demographics by Doctorate Degree
Demographics Similar to Asians by Doctorate Degree
In terms of doctorate degree, the demographic groups most similar to Asians are Immigrants from Asia (2.4%, a difference of 0.13%), Immigrants from Western Europe (2.4%, a difference of 0.21%), Immigrants from Austria (2.4%, a difference of 0.44%), Immigrants from South Africa (2.4%, a difference of 0.57%), and Immigrants from Norway (2.4%, a difference of 1.3%).
| Demographics | Rating | Rank | Doctorate Degree |
| Immigrants | Russia | 100.0 /100 | #41 | Exceptional 2.5% |
| New Zealanders | 100.0 /100 | #42 | Exceptional 2.5% |
| Soviet Union | 100.0 /100 | #43 | Exceptional 2.5% |
| Immigrants | Netherlands | 100.0 /100 | #44 | Exceptional 2.5% |
| Immigrants | South Africa | 100.0 /100 | #45 | Exceptional 2.4% |
| Immigrants | Austria | 100.0 /100 | #46 | Exceptional 2.4% |
| Immigrants | Western Europe | 100.0 /100 | #47 | Exceptional 2.4% |
| Asians | 100.0 /100 | #48 | Exceptional 2.4% |
| Immigrants | Asia | 100.0 /100 | #49 | Exceptional 2.4% |
| Immigrants | Norway | 100.0 /100 | #50 | Exceptional 2.4% |
| Australians | 100.0 /100 | #51 | Exceptional 2.4% |
| Bulgarians | 100.0 /100 | #52 | Exceptional 2.4% |
| Immigrants | Latvia | 100.0 /100 | #53 | Exceptional 2.4% |
| Immigrants | Indonesia | 100.0 /100 | #54 | Exceptional 2.4% |
| Bolivians | 100.0 /100 | #55 | Exceptional 2.4% |
Demographics Similar to Immigrants from Philippines by Doctorate Degree
In terms of doctorate degree, the demographic groups most similar to Immigrants from Philippines are Colville (1.6%, a difference of 0.31%), Immigrants from North Macedonia (1.6%, a difference of 0.47%), Guamanian/Chamorro (1.6%, a difference of 1.2%), Barbadian (1.6%, a difference of 1.2%), and Assyrian/Chaldean/Syriac (1.7%, a difference of 1.3%).
| Demographics | Rating | Rank | Doctorate Degree |
| Immigrants | Bosnia and Herzegovina | 7.8 /100 | #223 | Tragic 1.7% |
| Immigrants | Poland | 7.4 /100 | #224 | Tragic 1.7% |
| Immigrants | Colombia | 6.7 /100 | #225 | Tragic 1.7% |
| Osage | 6.5 /100 | #226 | Tragic 1.7% |
| Panamanians | 6.3 /100 | #227 | Tragic 1.7% |
| Assyrians/Chaldeans/Syriacs | 5.9 /100 | #228 | Tragic 1.7% |
| Colville | 4.7 /100 | #229 | Tragic 1.6% |
| Immigrants | Philippines | 4.3 /100 | #230 | Tragic 1.6% |
| Immigrants | North Macedonia | 3.9 /100 | #231 | Tragic 1.6% |
| Guamanians/Chamorros | 3.3 /100 | #232 | Tragic 1.6% |
| Barbadians | 3.3 /100 | #233 | Tragic 1.6% |
| Hopi | 3.2 /100 | #234 | Tragic 1.6% |
| Cree | 3.0 /100 | #235 | Tragic 1.6% |
| Indonesians | 2.8 /100 | #236 | Tragic 1.6% |
| Iroquois | 2.7 /100 | #237 | Tragic 1.6% |