Immigrants from China vs Immigrants from Philippines Doctorate Degree
COMPARE
Immigrants from China
Immigrants from Philippines
Doctorate Degree
Doctorate Degree Comparison
Immigrants from China
Immigrants from Philippines
3.1%
DOCTORATE DEGREE
100.0/ 100
METRIC RATING
7th/ 347
METRIC RANK
1.6%
DOCTORATE DEGREE
4.3/ 100
METRIC RATING
230th/ 347
METRIC RANK
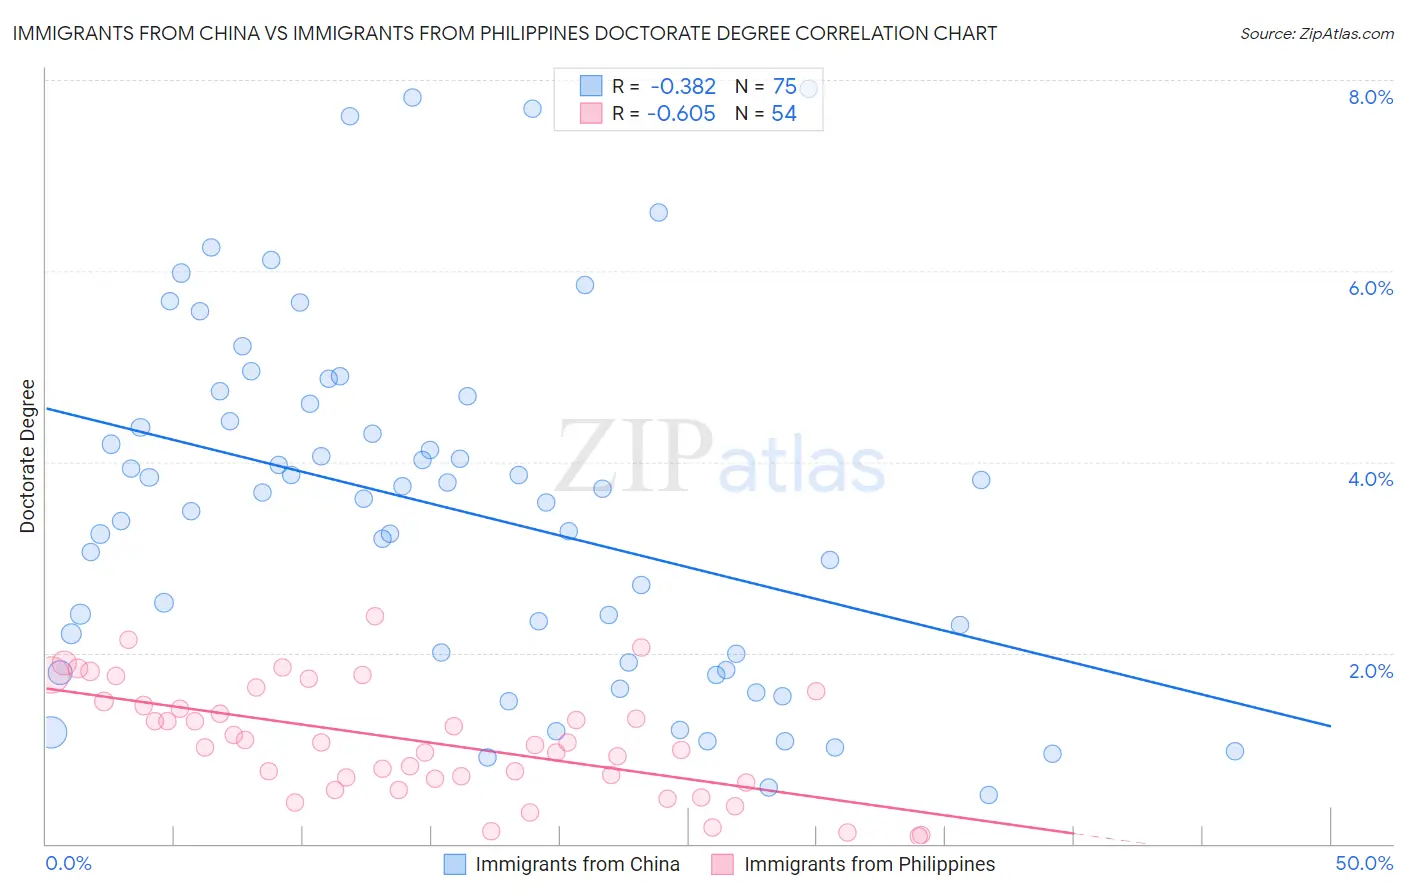
Immigrants from China vs Immigrants from Philippines Doctorate Degree Correlation Chart
The statistical analysis conducted on geographies consisting of 452,322,361 people shows a mild negative correlation between the proportion of Immigrants from China and percentage of population with at least doctorate degree education in the United States with a correlation coefficient (R) of -0.382 and weighted average of 3.1%. Similarly, the statistical analysis conducted on geographies consisting of 464,152,098 people shows a significant negative correlation between the proportion of Immigrants from Philippines and percentage of population with at least doctorate degree education in the United States with a correlation coefficient (R) of -0.605 and weighted average of 1.6%, a difference of 89.4%.
Doctorate Degree Correlation Summary
| Measurement | Immigrants from China | Immigrants from Philippines |
| Minimum | 0.51% | 0.076% |
| Maximum | 7.9% | 2.4% |
| Range | 7.4% | 2.3% |
| Mean | 3.5% | 1.1% |
| Median | 3.6% | 1.0% |
| Interquartile 25% (IQ1) | 1.9% | 0.68% |
| Interquartile 75% (IQ3) | 4.6% | 1.5% |
| Interquartile Range (IQR) | 2.7% | 0.81% |
| Standard Deviation (Sample) | 1.8% | 0.58% |
| Standard Deviation (Population) | 1.8% | 0.57% |
Similar Demographics by Doctorate Degree
Demographics Similar to Immigrants from China by Doctorate Degree
In terms of doctorate degree, the demographic groups most similar to Immigrants from China are Immigrants from Switzerland (3.1%, a difference of 0.070%), Immigrants from Israel (3.0%, a difference of 1.3%), Iranian (3.1%, a difference of 2.0%), Immigrants from Iran (3.0%, a difference of 2.0%), and Immigrants from Taiwan (3.2%, a difference of 3.6%).
| Demographics | Rating | Rank | Doctorate Degree |
| Immigrants | Singapore | 100.0 /100 | #1 | Exceptional 3.7% |
| Filipinos | 100.0 /100 | #2 | Exceptional 3.4% |
| Okinawans | 100.0 /100 | #3 | Exceptional 3.3% |
| Immigrants | Taiwan | 100.0 /100 | #4 | Exceptional 3.2% |
| Iranians | 100.0 /100 | #5 | Exceptional 3.1% |
| Immigrants | Switzerland | 100.0 /100 | #6 | Exceptional 3.1% |
| Immigrants | China | 100.0 /100 | #7 | Exceptional 3.1% |
| Immigrants | Israel | 100.0 /100 | #8 | Exceptional 3.0% |
| Immigrants | Iran | 100.0 /100 | #9 | Exceptional 3.0% |
| Immigrants | Eastern Asia | 100.0 /100 | #10 | Exceptional 3.0% |
| Indians (Asian) | 100.0 /100 | #11 | Exceptional 2.9% |
| Immigrants | Belgium | 100.0 /100 | #12 | Exceptional 2.9% |
| Immigrants | Sweden | 100.0 /100 | #13 | Exceptional 2.9% |
| Immigrants | France | 100.0 /100 | #14 | Exceptional 2.9% |
| Immigrants | India | 100.0 /100 | #15 | Exceptional 2.8% |
Demographics Similar to Immigrants from Philippines by Doctorate Degree
In terms of doctorate degree, the demographic groups most similar to Immigrants from Philippines are Colville (1.6%, a difference of 0.31%), Immigrants from North Macedonia (1.6%, a difference of 0.47%), Guamanian/Chamorro (1.6%, a difference of 1.2%), Barbadian (1.6%, a difference of 1.2%), and Assyrian/Chaldean/Syriac (1.7%, a difference of 1.3%).
| Demographics | Rating | Rank | Doctorate Degree |
| Immigrants | Bosnia and Herzegovina | 7.8 /100 | #223 | Tragic 1.7% |
| Immigrants | Poland | 7.4 /100 | #224 | Tragic 1.7% |
| Immigrants | Colombia | 6.7 /100 | #225 | Tragic 1.7% |
| Osage | 6.5 /100 | #226 | Tragic 1.7% |
| Panamanians | 6.3 /100 | #227 | Tragic 1.7% |
| Assyrians/Chaldeans/Syriacs | 5.9 /100 | #228 | Tragic 1.7% |
| Colville | 4.7 /100 | #229 | Tragic 1.6% |
| Immigrants | Philippines | 4.3 /100 | #230 | Tragic 1.6% |
| Immigrants | North Macedonia | 3.9 /100 | #231 | Tragic 1.6% |
| Guamanians/Chamorros | 3.3 /100 | #232 | Tragic 1.6% |
| Barbadians | 3.3 /100 | #233 | Tragic 1.6% |
| Hopi | 3.2 /100 | #234 | Tragic 1.6% |
| Cree | 3.0 /100 | #235 | Tragic 1.6% |
| Indonesians | 2.8 /100 | #236 | Tragic 1.6% |
| Iroquois | 2.7 /100 | #237 | Tragic 1.6% |