Marshallese vs Immigrants from Korea Bachelor's Degree
COMPARE
Marshallese
Immigrants from Korea
Bachelor's Degree
Bachelor's Degree Comparison
Marshallese
Immigrants from Korea
31.7%
BACHELOR'S DEGREE
0.1/ 100
METRIC RATING
278th/ 347
METRIC RANK
47.0%
BACHELOR'S DEGREE
100.0/ 100
METRIC RATING
24th/ 347
METRIC RANK
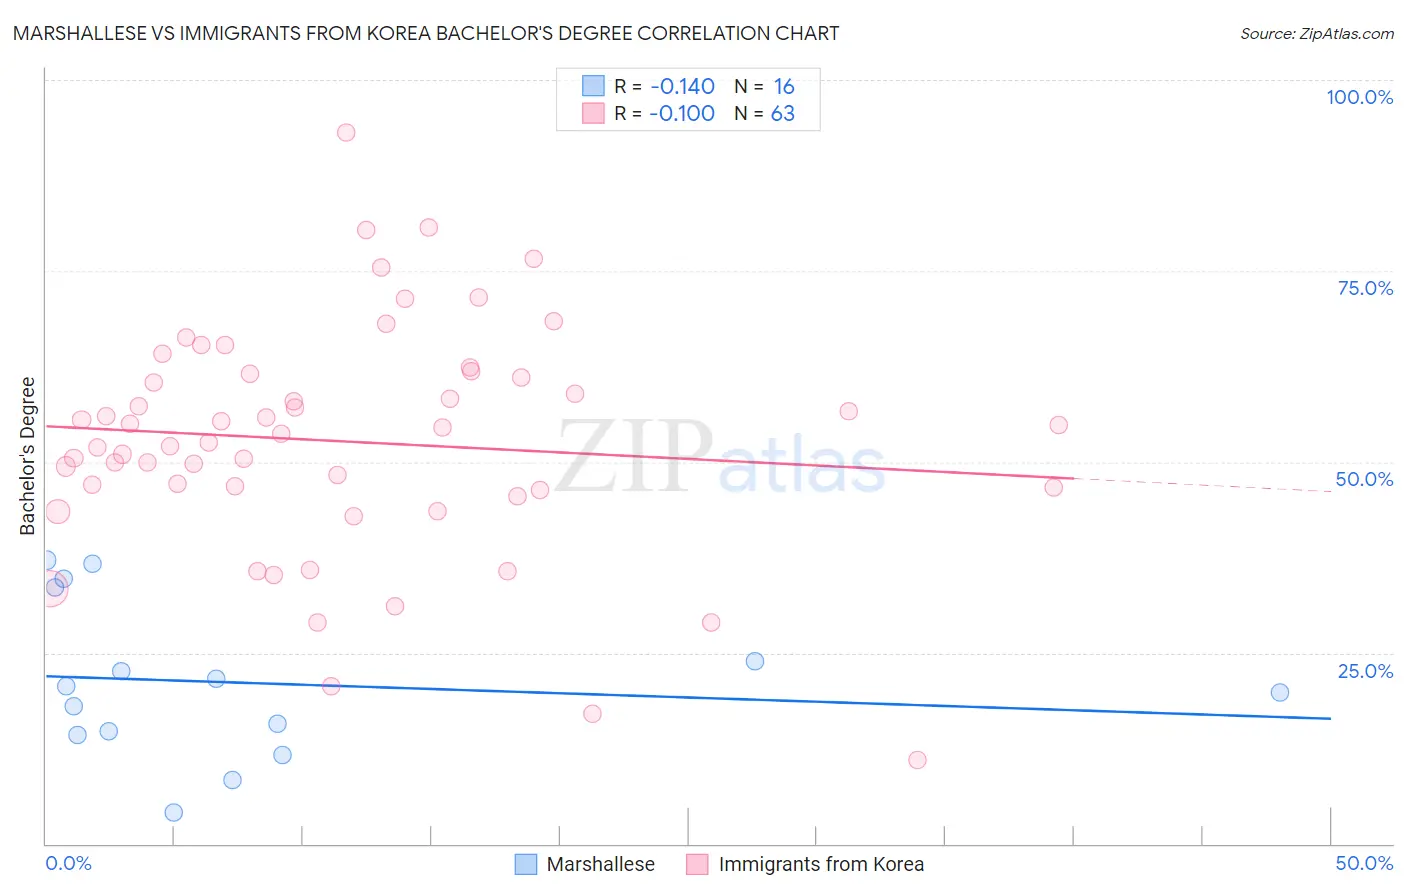
Marshallese vs Immigrants from Korea Bachelor's Degree Correlation Chart
The statistical analysis conducted on geographies consisting of 14,761,315 people shows a poor negative correlation between the proportion of Marshallese and percentage of population with at least bachelor's degree education in the United States with a correlation coefficient (R) of -0.140 and weighted average of 31.7%. Similarly, the statistical analysis conducted on geographies consisting of 416,289,272 people shows a slight negative correlation between the proportion of Immigrants from Korea and percentage of population with at least bachelor's degree education in the United States with a correlation coefficient (R) of -0.100 and weighted average of 47.0%, a difference of 48.0%.
Bachelor's Degree Correlation Summary
| Measurement | Marshallese | Immigrants from Korea |
| Minimum | 4.0% | 10.9% |
| Maximum | 37.2% | 93.1% |
| Range | 33.1% | 82.2% |
| Mean | 21.1% | 52.7% |
| Median | 20.2% | 53.7% |
| Interquartile 25% (IQ1) | 14.4% | 46.3% |
| Interquartile 75% (IQ3) | 28.8% | 61.5% |
| Interquartile Range (IQR) | 14.3% | 15.2% |
| Standard Deviation (Sample) | 10.1% | 15.3% |
| Standard Deviation (Population) | 9.8% | 15.1% |
Similar Demographics by Bachelor's Degree
Demographics Similar to Marshallese by Bachelor's Degree
In terms of bachelor's degree, the demographic groups most similar to Marshallese are Dominican (31.8%, a difference of 0.050%), Salvadoran (31.8%, a difference of 0.20%), Samoan (31.8%, a difference of 0.24%), Hawaiian (31.6%, a difference of 0.35%), and Potawatomi (31.9%, a difference of 0.37%).
| Demographics | Rating | Rank | Bachelor's Degree |
| Central Americans | 0.2 /100 | #271 | Tragic 31.9% |
| Comanche | 0.2 /100 | #272 | Tragic 31.9% |
| Americans | 0.2 /100 | #273 | Tragic 31.9% |
| Potawatomi | 0.2 /100 | #274 | Tragic 31.9% |
| Samoans | 0.1 /100 | #275 | Tragic 31.8% |
| Salvadorans | 0.1 /100 | #276 | Tragic 31.8% |
| Dominicans | 0.1 /100 | #277 | Tragic 31.8% |
| Marshallese | 0.1 /100 | #278 | Tragic 31.7% |
| Hawaiians | 0.1 /100 | #279 | Tragic 31.6% |
| Immigrants | Laos | 0.1 /100 | #280 | Tragic 31.6% |
| Blackfeet | 0.1 /100 | #281 | Tragic 31.5% |
| Immigrants | Caribbean | 0.1 /100 | #282 | Tragic 31.4% |
| Hondurans | 0.1 /100 | #283 | Tragic 31.3% |
| Haitians | 0.1 /100 | #284 | Tragic 31.3% |
| Aleuts | 0.1 /100 | #285 | Tragic 31.3% |
Demographics Similar to Immigrants from Korea by Bachelor's Degree
In terms of bachelor's degree, the demographic groups most similar to Immigrants from Korea are Immigrants from Sweden (47.0%, a difference of 0.040%), Immigrants from Belgium (47.0%, a difference of 0.13%), Burmese (46.9%, a difference of 0.22%), Immigrants from Ireland (47.1%, a difference of 0.33%), and Immigrants from Japan (46.8%, a difference of 0.33%).
| Demographics | Rating | Rank | Bachelor's Degree |
| Eastern Europeans | 100.0 /100 | #17 | Exceptional 47.5% |
| Indians (Asian) | 100.0 /100 | #18 | Exceptional 47.4% |
| Cambodians | 100.0 /100 | #19 | Exceptional 47.2% |
| Immigrants | Switzerland | 100.0 /100 | #20 | Exceptional 47.1% |
| Immigrants | Ireland | 100.0 /100 | #21 | Exceptional 47.1% |
| Immigrants | Belgium | 100.0 /100 | #22 | Exceptional 47.0% |
| Immigrants | Sweden | 100.0 /100 | #23 | Exceptional 47.0% |
| Immigrants | Korea | 100.0 /100 | #24 | Exceptional 47.0% |
| Burmese | 100.0 /100 | #25 | Exceptional 46.9% |
| Immigrants | Japan | 100.0 /100 | #26 | Exceptional 46.8% |
| Immigrants | France | 100.0 /100 | #27 | Exceptional 46.4% |
| Turks | 100.0 /100 | #28 | Exceptional 46.2% |
| Israelis | 100.0 /100 | #29 | Exceptional 46.1% |
| Immigrants | Sri Lanka | 100.0 /100 | #30 | Exceptional 46.1% |
| Latvians | 100.0 /100 | #31 | Exceptional 46.1% |