Marshallese vs Palestinian Bachelor's Degree
COMPARE
Marshallese
Palestinian
Bachelor's Degree
Bachelor's Degree Comparison
Marshallese
Palestinians
31.7%
BACHELOR'S DEGREE
0.1/ 100
METRIC RATING
278th/ 347
METRIC RANK
40.7%
BACHELOR'S DEGREE
95.8/ 100
METRIC RATING
115th/ 347
METRIC RANK
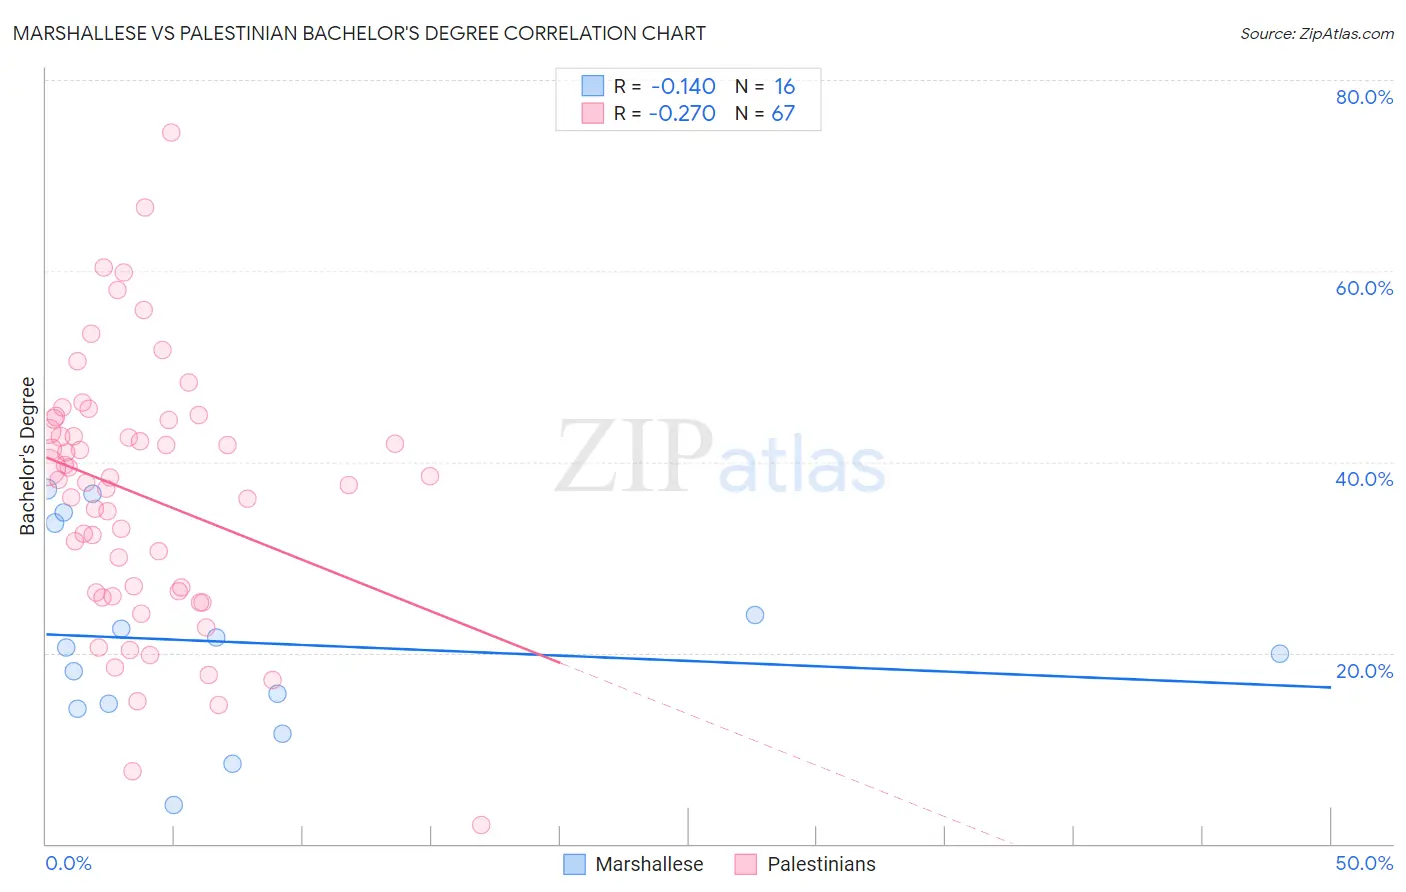
Marshallese vs Palestinian Bachelor's Degree Correlation Chart
The statistical analysis conducted on geographies consisting of 14,761,315 people shows a poor negative correlation between the proportion of Marshallese and percentage of population with at least bachelor's degree education in the United States with a correlation coefficient (R) of -0.140 and weighted average of 31.7%. Similarly, the statistical analysis conducted on geographies consisting of 216,450,003 people shows a weak negative correlation between the proportion of Palestinians and percentage of population with at least bachelor's degree education in the United States with a correlation coefficient (R) of -0.270 and weighted average of 40.7%, a difference of 28.3%.
Bachelor's Degree Correlation Summary
| Measurement | Marshallese | Palestinian |
| Minimum | 4.0% | 1.9% |
| Maximum | 37.2% | 74.5% |
| Range | 33.1% | 72.6% |
| Mean | 21.1% | 36.5% |
| Median | 20.2% | 38.1% |
| Interquartile 25% (IQ1) | 14.4% | 26.3% |
| Interquartile 75% (IQ3) | 28.8% | 44.4% |
| Interquartile Range (IQR) | 14.3% | 18.1% |
| Standard Deviation (Sample) | 10.1% | 13.6% |
| Standard Deviation (Population) | 9.8% | 13.5% |
Similar Demographics by Bachelor's Degree
Demographics Similar to Marshallese by Bachelor's Degree
In terms of bachelor's degree, the demographic groups most similar to Marshallese are Dominican (31.8%, a difference of 0.050%), Salvadoran (31.8%, a difference of 0.20%), Samoan (31.8%, a difference of 0.24%), Hawaiian (31.6%, a difference of 0.35%), and Potawatomi (31.9%, a difference of 0.37%).
| Demographics | Rating | Rank | Bachelor's Degree |
| Central Americans | 0.2 /100 | #271 | Tragic 31.9% |
| Comanche | 0.2 /100 | #272 | Tragic 31.9% |
| Americans | 0.2 /100 | #273 | Tragic 31.9% |
| Potawatomi | 0.2 /100 | #274 | Tragic 31.9% |
| Samoans | 0.1 /100 | #275 | Tragic 31.8% |
| Salvadorans | 0.1 /100 | #276 | Tragic 31.8% |
| Dominicans | 0.1 /100 | #277 | Tragic 31.8% |
| Marshallese | 0.1 /100 | #278 | Tragic 31.7% |
| Hawaiians | 0.1 /100 | #279 | Tragic 31.6% |
| Immigrants | Laos | 0.1 /100 | #280 | Tragic 31.6% |
| Blackfeet | 0.1 /100 | #281 | Tragic 31.5% |
| Immigrants | Caribbean | 0.1 /100 | #282 | Tragic 31.4% |
| Hondurans | 0.1 /100 | #283 | Tragic 31.3% |
| Haitians | 0.1 /100 | #284 | Tragic 31.3% |
| Aleuts | 0.1 /100 | #285 | Tragic 31.3% |
Demographics Similar to Palestinians by Bachelor's Degree
In terms of bachelor's degree, the demographic groups most similar to Palestinians are Immigrants from Uganda (40.7%, a difference of 0.050%), Austrian (40.6%, a difference of 0.15%), Croatian (40.6%, a difference of 0.17%), Afghan (40.8%, a difference of 0.24%), and Brazilian (40.8%, a difference of 0.26%).
| Demographics | Rating | Rank | Bachelor's Degree |
| Ukrainians | 96.6 /100 | #108 | Exceptional 40.9% |
| Arabs | 96.6 /100 | #109 | Exceptional 40.9% |
| Albanians | 96.5 /100 | #110 | Exceptional 40.9% |
| Immigrants | Chile | 96.4 /100 | #111 | Exceptional 40.8% |
| Ugandans | 96.3 /100 | #112 | Exceptional 40.8% |
| Brazilians | 96.3 /100 | #113 | Exceptional 40.8% |
| Afghans | 96.2 /100 | #114 | Exceptional 40.8% |
| Palestinians | 95.8 /100 | #115 | Exceptional 40.7% |
| Immigrants | Uganda | 95.7 /100 | #116 | Exceptional 40.7% |
| Austrians | 95.5 /100 | #117 | Exceptional 40.6% |
| Croatians | 95.5 /100 | #118 | Exceptional 40.6% |
| Immigrants | Syria | 94.9 /100 | #119 | Exceptional 40.5% |
| Venezuelans | 94.7 /100 | #120 | Exceptional 40.5% |
| Moroccans | 94.6 /100 | #121 | Exceptional 40.5% |
| Immigrants | Albania | 94.4 /100 | #122 | Exceptional 40.4% |