Canadian vs Immigrants from Korea Bachelor's Degree
COMPARE
Canadian
Immigrants from Korea
Bachelor's Degree
Bachelor's Degree Comparison
Canadians
Immigrants from Korea
38.8%
BACHELOR'S DEGREE
75.0/ 100
METRIC RATING
154th/ 347
METRIC RANK
47.0%
BACHELOR'S DEGREE
100.0/ 100
METRIC RATING
24th/ 347
METRIC RANK
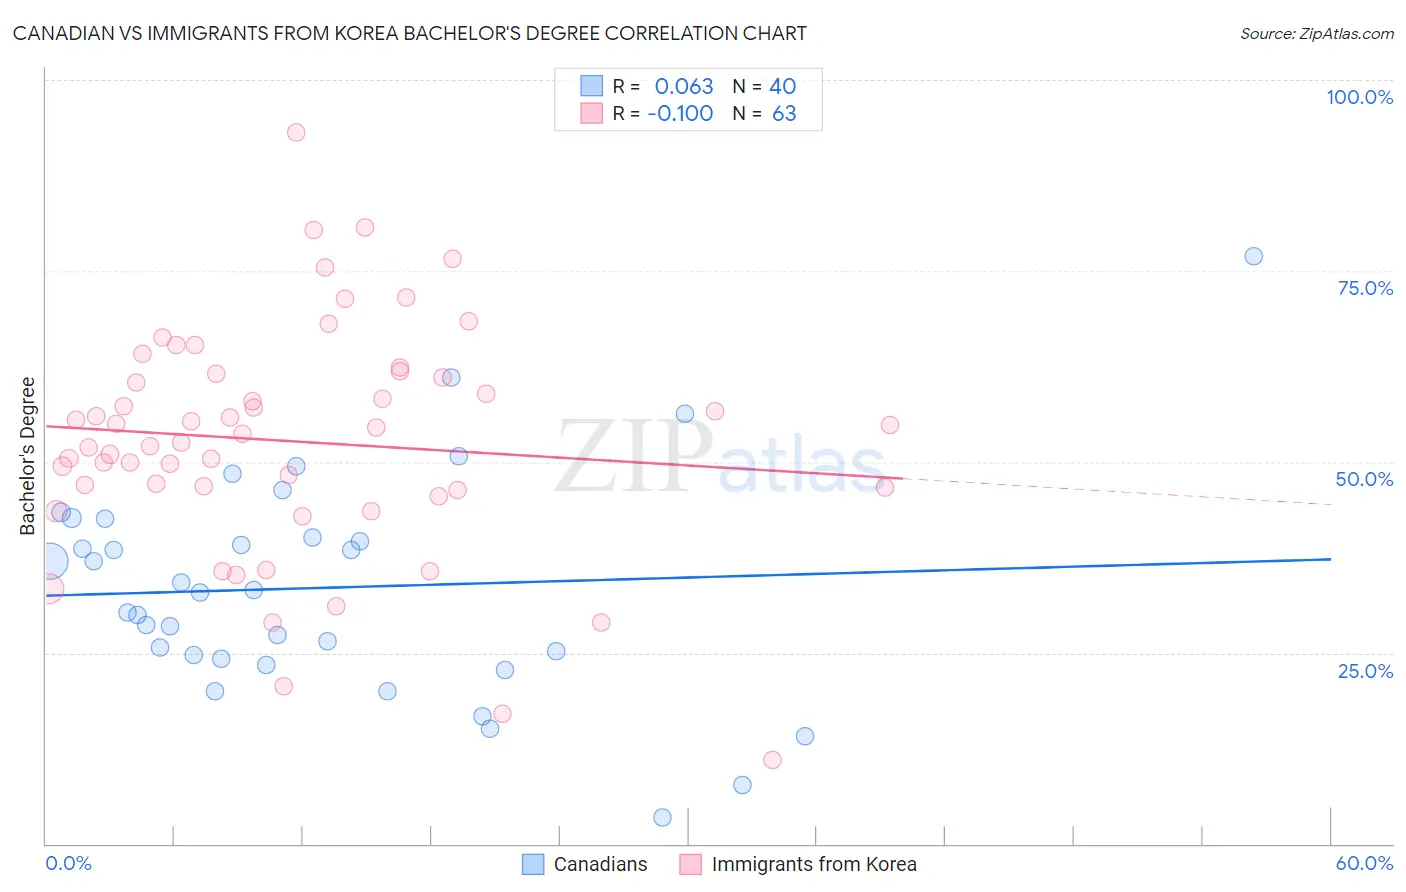
Canadian vs Immigrants from Korea Bachelor's Degree Correlation Chart
The statistical analysis conducted on geographies consisting of 437,524,144 people shows a slight positive correlation between the proportion of Canadians and percentage of population with at least bachelor's degree education in the United States with a correlation coefficient (R) of 0.063 and weighted average of 38.8%. Similarly, the statistical analysis conducted on geographies consisting of 416,289,272 people shows a slight negative correlation between the proportion of Immigrants from Korea and percentage of population with at least bachelor's degree education in the United States with a correlation coefficient (R) of -0.100 and weighted average of 47.0%, a difference of 21.0%.
Bachelor's Degree Correlation Summary
| Measurement | Canadian | Immigrants from Korea |
| Minimum | 3.4% | 10.9% |
| Maximum | 76.9% | 93.1% |
| Range | 73.5% | 82.2% |
| Mean | 33.5% | 52.7% |
| Median | 33.0% | 53.7% |
| Interquartile 25% (IQ1) | 24.5% | 46.3% |
| Interquartile 75% (IQ3) | 41.3% | 61.5% |
| Interquartile Range (IQR) | 16.8% | 15.2% |
| Standard Deviation (Sample) | 14.5% | 15.3% |
| Standard Deviation (Population) | 14.3% | 15.1% |
Similar Demographics by Bachelor's Degree
Demographics Similar to Canadians by Bachelor's Degree
In terms of bachelor's degree, the demographic groups most similar to Canadians are Slavic (38.9%, a difference of 0.12%), Immigrants from Kenya (38.8%, a difference of 0.15%), Sudanese (38.9%, a difference of 0.18%), Immigrants from Africa (38.9%, a difference of 0.20%), and South American (38.9%, a difference of 0.29%).
| Demographics | Rating | Rank | Bachelor's Degree |
| Immigrants | Sierra Leone | 79.0 /100 | #147 | Good 39.0% |
| Iraqis | 78.1 /100 | #148 | Good 39.0% |
| Immigrants | Poland | 77.5 /100 | #149 | Good 39.0% |
| South Americans | 77.3 /100 | #150 | Good 38.9% |
| Immigrants | Africa | 76.5 /100 | #151 | Good 38.9% |
| Sudanese | 76.4 /100 | #152 | Good 38.9% |
| Slavs | 75.9 /100 | #153 | Good 38.9% |
| Canadians | 75.0 /100 | #154 | Good 38.8% |
| Immigrants | Kenya | 73.8 /100 | #155 | Good 38.8% |
| Kenyans | 72.5 /100 | #156 | Good 38.7% |
| Immigrants | South America | 70.1 /100 | #157 | Good 38.6% |
| Immigrants | Germany | 69.6 /100 | #158 | Good 38.6% |
| Chinese | 66.6 /100 | #159 | Good 38.5% |
| Vietnamese | 66.6 /100 | #160 | Good 38.5% |
| Uruguayans | 65.8 /100 | #161 | Good 38.4% |
Demographics Similar to Immigrants from Korea by Bachelor's Degree
In terms of bachelor's degree, the demographic groups most similar to Immigrants from Korea are Immigrants from Sweden (47.0%, a difference of 0.040%), Immigrants from Belgium (47.0%, a difference of 0.13%), Burmese (46.9%, a difference of 0.22%), Immigrants from Ireland (47.1%, a difference of 0.33%), and Immigrants from Japan (46.8%, a difference of 0.33%).
| Demographics | Rating | Rank | Bachelor's Degree |
| Eastern Europeans | 100.0 /100 | #17 | Exceptional 47.5% |
| Indians (Asian) | 100.0 /100 | #18 | Exceptional 47.4% |
| Cambodians | 100.0 /100 | #19 | Exceptional 47.2% |
| Immigrants | Switzerland | 100.0 /100 | #20 | Exceptional 47.1% |
| Immigrants | Ireland | 100.0 /100 | #21 | Exceptional 47.1% |
| Immigrants | Belgium | 100.0 /100 | #22 | Exceptional 47.0% |
| Immigrants | Sweden | 100.0 /100 | #23 | Exceptional 47.0% |
| Immigrants | Korea | 100.0 /100 | #24 | Exceptional 47.0% |
| Burmese | 100.0 /100 | #25 | Exceptional 46.9% |
| Immigrants | Japan | 100.0 /100 | #26 | Exceptional 46.8% |
| Immigrants | France | 100.0 /100 | #27 | Exceptional 46.4% |
| Turks | 100.0 /100 | #28 | Exceptional 46.2% |
| Israelis | 100.0 /100 | #29 | Exceptional 46.1% |
| Immigrants | Sri Lanka | 100.0 /100 | #30 | Exceptional 46.1% |
| Latvians | 100.0 /100 | #31 | Exceptional 46.1% |