Malaysian vs Norwegian No Schooling Completed
COMPARE
Malaysian
Norwegian
No Schooling Completed
No Schooling Completed Comparison
Malaysians
Norwegians
2.8%
NO SCHOOLING COMPLETED
0.0/ 100
METRIC RATING
293rd/ 347
METRIC RANK
1.3%
NO SCHOOLING COMPLETED
100.0/ 100
METRIC RATING
3rd/ 347
METRIC RANK
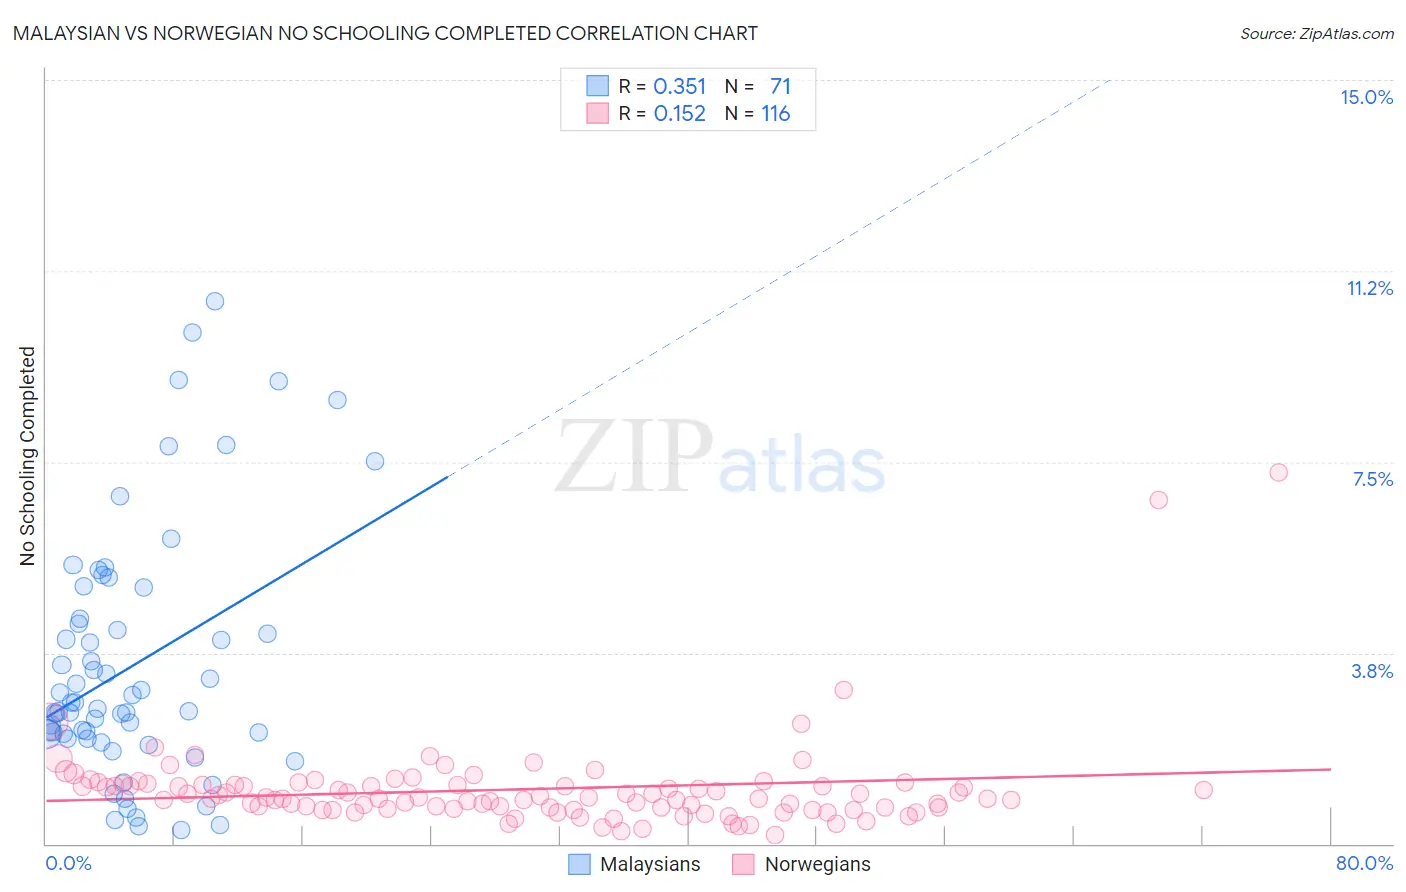
Malaysian vs Norwegian No Schooling Completed Correlation Chart
The statistical analysis conducted on geographies consisting of 225,077,175 people shows a mild positive correlation between the proportion of Malaysians and percentage of population with no schooling in the United States with a correlation coefficient (R) of 0.351 and weighted average of 2.8%. Similarly, the statistical analysis conducted on geographies consisting of 518,592,582 people shows a poor positive correlation between the proportion of Norwegians and percentage of population with no schooling in the United States with a correlation coefficient (R) of 0.152 and weighted average of 1.3%, a difference of 105.2%.
No Schooling Completed Correlation Summary
| Measurement | Malaysian | Norwegian |
| Minimum | 0.27% | 0.17% |
| Maximum | 10.6% | 7.3% |
| Range | 10.4% | 7.1% |
| Mean | 3.5% | 1.1% |
| Median | 2.7% | 0.89% |
| Interquartile 25% (IQ1) | 2.1% | 0.70% |
| Interquartile 75% (IQ3) | 4.4% | 1.2% |
| Interquartile Range (IQR) | 2.4% | 0.46% |
| Standard Deviation (Sample) | 2.4% | 0.90% |
| Standard Deviation (Population) | 2.4% | 0.90% |
Similar Demographics by No Schooling Completed
Demographics Similar to Malaysians by No Schooling Completed
In terms of no schooling completed, the demographic groups most similar to Malaysians are Immigrants from Eritrea (2.8%, a difference of 0.17%), Immigrants from Grenada (2.8%, a difference of 0.41%), Houma (2.8%, a difference of 0.69%), Immigrants (2.8%, a difference of 0.79%), and British West Indian (2.7%, a difference of 1.5%).
| Demographics | Rating | Rank | No Schooling Completed |
| Immigrants | Portugal | 0.0 /100 | #286 | Tragic 2.7% |
| Immigrants | Afghanistan | 0.0 /100 | #287 | Tragic 2.7% |
| Immigrants | St. Vincent and the Grenadines | 0.0 /100 | #288 | Tragic 2.7% |
| Immigrants | Thailand | 0.0 /100 | #289 | Tragic 2.7% |
| Immigrants | Hong Kong | 0.0 /100 | #290 | Tragic 2.7% |
| British West Indians | 0.0 /100 | #291 | Tragic 2.7% |
| Immigrants | Grenada | 0.0 /100 | #292 | Tragic 2.8% |
| Malaysians | 0.0 /100 | #293 | Tragic 2.8% |
| Immigrants | Eritrea | 0.0 /100 | #294 | Tragic 2.8% |
| Houma | 0.0 /100 | #295 | Tragic 2.8% |
| Immigrants | Immigrants | 0.0 /100 | #296 | Tragic 2.8% |
| Immigrants | Cuba | 0.0 /100 | #297 | Tragic 2.8% |
| Immigrants | Dominica | 0.0 /100 | #298 | Tragic 2.8% |
| Central American Indians | 0.0 /100 | #299 | Tragic 2.8% |
| Haitians | 0.0 /100 | #300 | Tragic 2.9% |
Demographics Similar to Norwegians by No Schooling Completed
In terms of no schooling completed, the demographic groups most similar to Norwegians are Slovak (1.3%, a difference of 0.43%), German (1.4%, a difference of 0.56%), Slovene (1.4%, a difference of 0.98%), Carpatho Rusyn (1.4%, a difference of 1.8%), and English (1.4%, a difference of 2.8%).
| Demographics | Rating | Rank | No Schooling Completed |
| Yup'ik | 100.0 /100 | #1 | Exceptional 1.2% |
| Slovaks | 100.0 /100 | #2 | Exceptional 1.3% |
| Norwegians | 100.0 /100 | #3 | Exceptional 1.3% |
| Germans | 100.0 /100 | #4 | Exceptional 1.4% |
| Slovenes | 100.0 /100 | #5 | Exceptional 1.4% |
| Carpatho Rusyns | 100.0 /100 | #6 | Exceptional 1.4% |
| English | 100.0 /100 | #7 | Exceptional 1.4% |
| Swedes | 100.0 /100 | #8 | Exceptional 1.4% |
| Scottish | 100.0 /100 | #9 | Exceptional 1.4% |
| Dutch | 100.0 /100 | #10 | Exceptional 1.4% |
| Lithuanians | 100.0 /100 | #11 | Exceptional 1.4% |
| Irish | 100.0 /100 | #12 | Exceptional 1.4% |
| Poles | 100.0 /100 | #13 | Exceptional 1.4% |
| Scotch-Irish | 100.0 /100 | #14 | Exceptional 1.5% |
| Tlingit-Haida | 100.0 /100 | #15 | Exceptional 1.5% |