Malaysian vs Blackfeet No Schooling Completed
COMPARE
Malaysian
Blackfeet
No Schooling Completed
No Schooling Completed Comparison
Malaysians
Blackfeet
2.8%
NO SCHOOLING COMPLETED
0.0/ 100
METRIC RATING
293rd/ 347
METRIC RANK
2.0%
NO SCHOOLING COMPLETED
72.9/ 100
METRIC RATING
150th/ 347
METRIC RANK
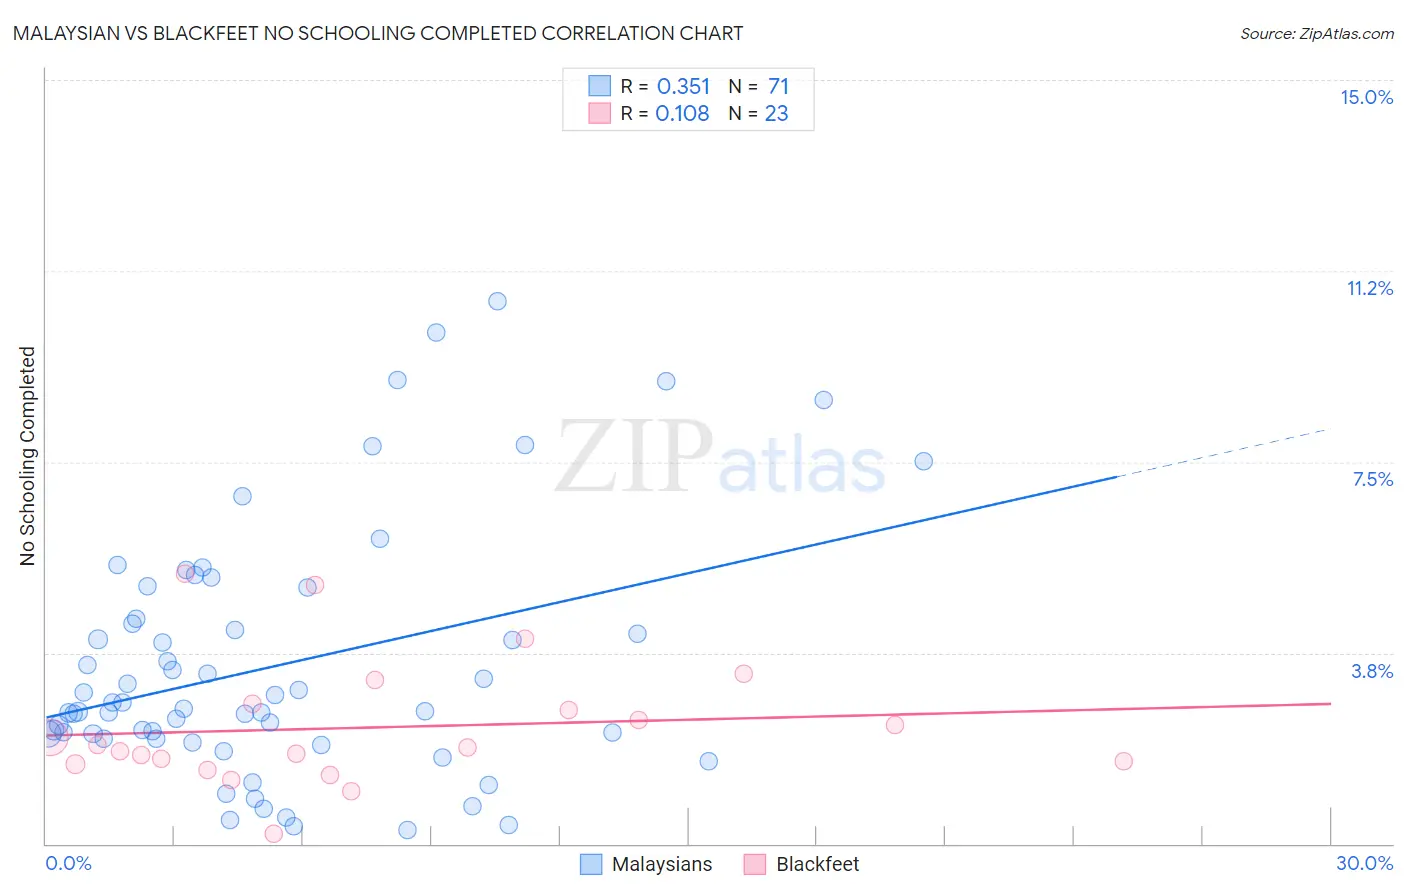
Malaysian vs Blackfeet No Schooling Completed Correlation Chart
The statistical analysis conducted on geographies consisting of 225,077,175 people shows a mild positive correlation between the proportion of Malaysians and percentage of population with no schooling in the United States with a correlation coefficient (R) of 0.351 and weighted average of 2.8%. Similarly, the statistical analysis conducted on geographies consisting of 307,289,730 people shows a poor positive correlation between the proportion of Blackfeet and percentage of population with no schooling in the United States with a correlation coefficient (R) of 0.108 and weighted average of 2.0%, a difference of 36.9%.
No Schooling Completed Correlation Summary
| Measurement | Malaysian | Blackfeet |
| Minimum | 0.27% | 0.20% |
| Maximum | 10.6% | 5.3% |
| Range | 10.4% | 5.1% |
| Mean | 3.5% | 2.3% |
| Median | 2.7% | 1.9% |
| Interquartile 25% (IQ1) | 2.1% | 1.6% |
| Interquartile 75% (IQ3) | 4.4% | 2.8% |
| Interquartile Range (IQR) | 2.4% | 1.2% |
| Standard Deviation (Sample) | 2.4% | 1.2% |
| Standard Deviation (Population) | 2.4% | 1.2% |
Similar Demographics by No Schooling Completed
Demographics Similar to Malaysians by No Schooling Completed
In terms of no schooling completed, the demographic groups most similar to Malaysians are Immigrants from Eritrea (2.8%, a difference of 0.17%), Immigrants from Grenada (2.8%, a difference of 0.41%), Houma (2.8%, a difference of 0.69%), Immigrants (2.8%, a difference of 0.79%), and British West Indian (2.7%, a difference of 1.5%).
| Demographics | Rating | Rank | No Schooling Completed |
| Immigrants | Portugal | 0.0 /100 | #286 | Tragic 2.7% |
| Immigrants | Afghanistan | 0.0 /100 | #287 | Tragic 2.7% |
| Immigrants | St. Vincent and the Grenadines | 0.0 /100 | #288 | Tragic 2.7% |
| Immigrants | Thailand | 0.0 /100 | #289 | Tragic 2.7% |
| Immigrants | Hong Kong | 0.0 /100 | #290 | Tragic 2.7% |
| British West Indians | 0.0 /100 | #291 | Tragic 2.7% |
| Immigrants | Grenada | 0.0 /100 | #292 | Tragic 2.8% |
| Malaysians | 0.0 /100 | #293 | Tragic 2.8% |
| Immigrants | Eritrea | 0.0 /100 | #294 | Tragic 2.8% |
| Houma | 0.0 /100 | #295 | Tragic 2.8% |
| Immigrants | Immigrants | 0.0 /100 | #296 | Tragic 2.8% |
| Immigrants | Cuba | 0.0 /100 | #297 | Tragic 2.8% |
| Immigrants | Dominica | 0.0 /100 | #298 | Tragic 2.8% |
| Central American Indians | 0.0 /100 | #299 | Tragic 2.8% |
| Haitians | 0.0 /100 | #300 | Tragic 2.9% |
Demographics Similar to Blackfeet by No Schooling Completed
In terms of no schooling completed, the demographic groups most similar to Blackfeet are Immigrants from Jordan (2.0%, a difference of 0.34%), Immigrants from Eastern Europe (2.0%, a difference of 0.43%), Immigrants from North Macedonia (2.0%, a difference of 0.56%), Immigrants from Italy (2.0%, a difference of 0.67%), and Shoshone (2.0%, a difference of 0.71%).
| Demographics | Rating | Rank | No Schooling Completed |
| Immigrants | South Central Asia | 80.0 /100 | #143 | Good 2.0% |
| Alsatians | 79.1 /100 | #144 | Good 2.0% |
| Immigrants | Iran | 79.0 /100 | #145 | Good 2.0% |
| Immigrants | Moldova | 78.0 /100 | #146 | Good 2.0% |
| Soviet Union | 77.1 /100 | #147 | Good 2.0% |
| Shoshone | 76.7 /100 | #148 | Good 2.0% |
| Immigrants | North Macedonia | 75.9 /100 | #149 | Good 2.0% |
| Blackfeet | 72.9 /100 | #150 | Good 2.0% |
| Immigrants | Jordan | 70.9 /100 | #151 | Good 2.0% |
| Immigrants | Eastern Europe | 70.4 /100 | #152 | Good 2.0% |
| Immigrants | Italy | 68.9 /100 | #153 | Good 2.0% |
| Immigrants | Venezuela | 68.5 /100 | #154 | Good 2.0% |
| Immigrants | Russia | 67.6 /100 | #155 | Good 2.0% |
| Chileans | 67.2 /100 | #156 | Good 2.0% |
| Immigrants | Sri Lanka | 67.0 /100 | #157 | Good 2.0% |