Costa Rican vs Norwegian No Schooling Completed
COMPARE
Costa Rican
Norwegian
No Schooling Completed
No Schooling Completed Comparison
Costa Ricans
Norwegians
2.2%
NO SCHOOLING COMPLETED
17.1/ 100
METRIC RATING
201st/ 347
METRIC RANK
1.3%
NO SCHOOLING COMPLETED
100.0/ 100
METRIC RATING
3rd/ 347
METRIC RANK
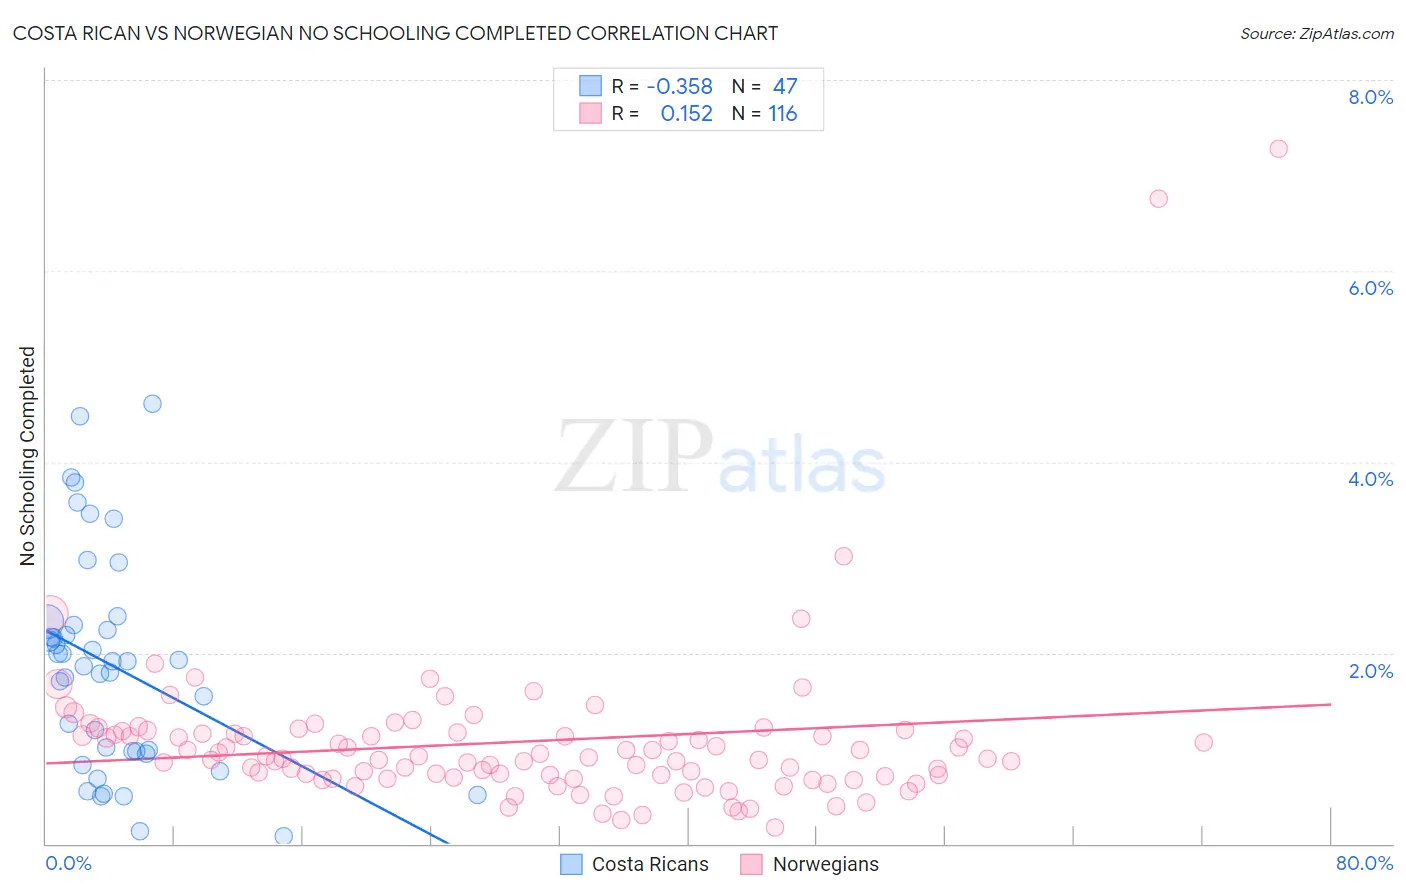
Costa Rican vs Norwegian No Schooling Completed Correlation Chart
The statistical analysis conducted on geographies consisting of 252,541,850 people shows a mild negative correlation between the proportion of Costa Ricans and percentage of population with no schooling in the United States with a correlation coefficient (R) of -0.358 and weighted average of 2.2%. Similarly, the statistical analysis conducted on geographies consisting of 518,592,582 people shows a poor positive correlation between the proportion of Norwegians and percentage of population with no schooling in the United States with a correlation coefficient (R) of 0.152 and weighted average of 1.3%, a difference of 63.3%.
No Schooling Completed Correlation Summary
| Measurement | Costa Rican | Norwegian |
| Minimum | 0.080% | 0.17% |
| Maximum | 4.6% | 7.3% |
| Range | 4.5% | 7.1% |
| Mean | 1.9% | 1.1% |
| Median | 1.9% | 0.89% |
| Interquartile 25% (IQ1) | 0.97% | 0.70% |
| Interquartile 75% (IQ3) | 2.3% | 1.2% |
| Interquartile Range (IQR) | 1.3% | 0.46% |
| Standard Deviation (Sample) | 1.1% | 0.90% |
| Standard Deviation (Population) | 1.1% | 0.90% |
Similar Demographics by No Schooling Completed
Demographics Similar to Costa Ricans by No Schooling Completed
In terms of no schooling completed, the demographic groups most similar to Costa Ricans are Immigrants from Northern Africa (2.2%, a difference of 0.52%), Moroccan (2.2%, a difference of 0.82%), Laotian (2.2%, a difference of 0.93%), African (2.2%, a difference of 0.98%), and Hopi (2.2%, a difference of 1.0%).
| Demographics | Rating | Rank | No Schooling Completed |
| Immigrants | Albania | 28.3 /100 | #194 | Fair 2.2% |
| Hawaiians | 27.0 /100 | #195 | Fair 2.2% |
| Immigrants | Ukraine | 26.1 /100 | #196 | Fair 2.2% |
| Immigrants | Southern Europe | 23.8 /100 | #197 | Fair 2.2% |
| Immigrants | Chile | 22.7 /100 | #198 | Fair 2.2% |
| Africans | 21.8 /100 | #199 | Fair 2.2% |
| Immigrants | Northern Africa | 19.5 /100 | #200 | Poor 2.2% |
| Costa Ricans | 17.1 /100 | #201 | Poor 2.2% |
| Moroccans | 13.7 /100 | #202 | Poor 2.2% |
| Laotians | 13.3 /100 | #203 | Poor 2.2% |
| Hopi | 12.9 /100 | #204 | Poor 2.2% |
| Immigrants | Bahamas | 11.6 /100 | #205 | Poor 2.2% |
| Bahamians | 11.6 /100 | #206 | Poor 2.2% |
| South American Indians | 11.0 /100 | #207 | Poor 2.2% |
| Uruguayans | 11.0 /100 | #208 | Poor 2.2% |
Demographics Similar to Norwegians by No Schooling Completed
In terms of no schooling completed, the demographic groups most similar to Norwegians are Slovak (1.3%, a difference of 0.43%), German (1.4%, a difference of 0.56%), Slovene (1.4%, a difference of 0.98%), Carpatho Rusyn (1.4%, a difference of 1.8%), and English (1.4%, a difference of 2.8%).
| Demographics | Rating | Rank | No Schooling Completed |
| Yup'ik | 100.0 /100 | #1 | Exceptional 1.2% |
| Slovaks | 100.0 /100 | #2 | Exceptional 1.3% |
| Norwegians | 100.0 /100 | #3 | Exceptional 1.3% |
| Germans | 100.0 /100 | #4 | Exceptional 1.4% |
| Slovenes | 100.0 /100 | #5 | Exceptional 1.4% |
| Carpatho Rusyns | 100.0 /100 | #6 | Exceptional 1.4% |
| English | 100.0 /100 | #7 | Exceptional 1.4% |
| Swedes | 100.0 /100 | #8 | Exceptional 1.4% |
| Scottish | 100.0 /100 | #9 | Exceptional 1.4% |
| Dutch | 100.0 /100 | #10 | Exceptional 1.4% |
| Lithuanians | 100.0 /100 | #11 | Exceptional 1.4% |
| Irish | 100.0 /100 | #12 | Exceptional 1.4% |
| Poles | 100.0 /100 | #13 | Exceptional 1.4% |
| Scotch-Irish | 100.0 /100 | #14 | Exceptional 1.5% |
| Tlingit-Haida | 100.0 /100 | #15 | Exceptional 1.5% |