Malaysian vs Immigrants from Fiji 11th Grade
COMPARE
Malaysian
Immigrants from Fiji
11th Grade
11th Grade Comparison
Malaysians
Immigrants from Fiji
90.8%
11TH GRADE
0.1/ 100
METRIC RATING
278th/ 347
METRIC RANK
89.9%
11TH GRADE
0.0/ 100
METRIC RATING
298th/ 347
METRIC RANK
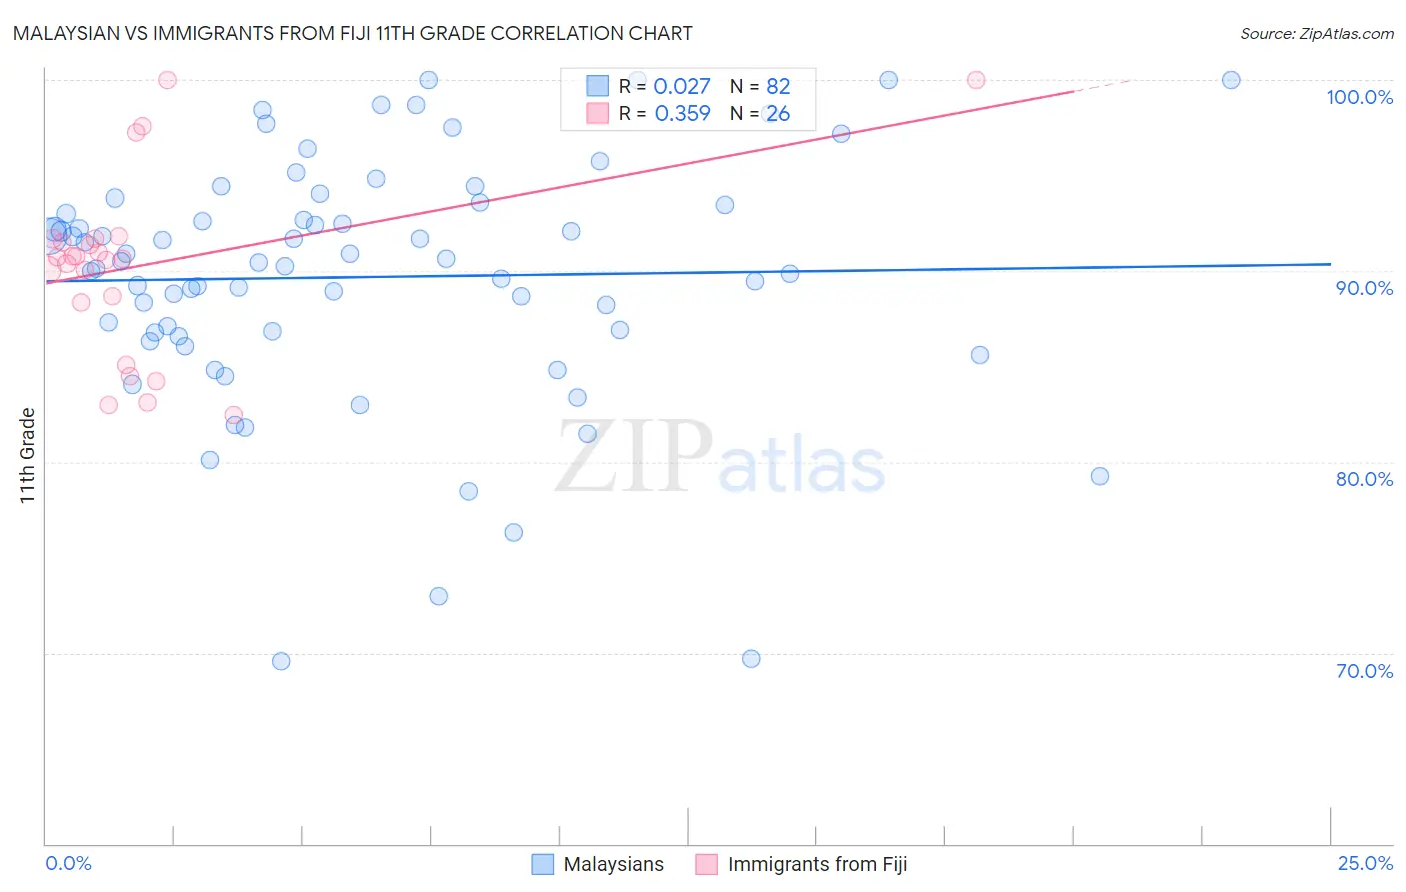
Malaysian vs Immigrants from Fiji 11th Grade Correlation Chart
The statistical analysis conducted on geographies consisting of 226,109,984 people shows no correlation between the proportion of Malaysians and percentage of population with at least 11th grade education in the United States with a correlation coefficient (R) of 0.027 and weighted average of 90.8%. Similarly, the statistical analysis conducted on geographies consisting of 93,756,204 people shows a mild positive correlation between the proportion of Immigrants from Fiji and percentage of population with at least 11th grade education in the United States with a correlation coefficient (R) of 0.359 and weighted average of 89.9%, a difference of 0.99%.
11th Grade Correlation Summary
| Measurement | Malaysian | Immigrants from Fiji |
| Minimum | 69.5% | 82.4% |
| Maximum | 100.0% | 100.0% |
| Range | 30.5% | 17.6% |
| Mean | 89.7% | 90.3% |
| Median | 90.5% | 90.7% |
| Interquartile 25% (IQ1) | 86.8% | 88.4% |
| Interquartile 75% (IQ3) | 93.5% | 91.7% |
| Interquartile Range (IQR) | 6.7% | 3.3% |
| Standard Deviation (Sample) | 6.4% | 4.8% |
| Standard Deviation (Population) | 6.4% | 4.7% |
Demographics Similar to Malaysians and Immigrants from Fiji by 11th Grade
In terms of 11th grade, the demographic groups most similar to Malaysians are Barbadian (90.8%, a difference of 0.040%), Sri Lankan (90.7%, a difference of 0.11%), Dutch West Indian (90.7%, a difference of 0.16%), Immigrants from St. Vincent and the Grenadines (90.7%, a difference of 0.17%), and Immigrants from Barbados (90.7%, a difference of 0.18%). Similarly, the demographic groups most similar to Immigrants from Fiji are Navajo (90.0%, a difference of 0.070%), Fijian (90.0%, a difference of 0.11%), Immigrants from Vietnam (90.0%, a difference of 0.13%), Immigrants from Grenada (90.1%, a difference of 0.23%), and Native/Alaskan (90.2%, a difference of 0.28%).
| Demographics | Rating | Rank | 11th Grade |
| Malaysians | 0.1 /100 | #278 | Tragic 90.8% |
| Barbadians | 0.0 /100 | #279 | Tragic 90.8% |
| Sri Lankans | 0.0 /100 | #280 | Tragic 90.7% |
| Dutch West Indians | 0.0 /100 | #281 | Tragic 90.7% |
| Immigrants | St. Vincent and the Grenadines | 0.0 /100 | #282 | Tragic 90.7% |
| Immigrants | Barbados | 0.0 /100 | #283 | Tragic 90.7% |
| Immigrants | Laos | 0.0 /100 | #284 | Tragic 90.5% |
| Immigrants | Burma/Myanmar | 0.0 /100 | #285 | Tragic 90.4% |
| Immigrants | West Indies | 0.0 /100 | #286 | Tragic 90.4% |
| Apache | 0.0 /100 | #287 | Tragic 90.4% |
| Pennsylvania Germans | 0.0 /100 | #288 | Tragic 90.3% |
| British West Indians | 0.0 /100 | #289 | Tragic 90.3% |
| Indonesians | 0.0 /100 | #290 | Tragic 90.3% |
| Haitians | 0.0 /100 | #291 | Tragic 90.3% |
| Cubans | 0.0 /100 | #292 | Tragic 90.2% |
| Natives/Alaskans | 0.0 /100 | #293 | Tragic 90.2% |
| Immigrants | Grenada | 0.0 /100 | #294 | Tragic 90.1% |
| Immigrants | Vietnam | 0.0 /100 | #295 | Tragic 90.0% |
| Fijians | 0.0 /100 | #296 | Tragic 90.0% |
| Navajo | 0.0 /100 | #297 | Tragic 90.0% |
| Immigrants | Fiji | 0.0 /100 | #298 | Tragic 89.9% |