Luxembourger vs Immigrants from Ghana Bachelor's Degree
COMPARE
Luxembourger
Immigrants from Ghana
Bachelor's Degree
Bachelor's Degree Comparison
Luxembourgers
Immigrants from Ghana
39.8%
BACHELOR'S DEGREE
89.1/ 100
METRIC RATING
135th/ 347
METRIC RANK
36.9%
BACHELOR'S DEGREE
27.4/ 100
METRIC RATING
200th/ 347
METRIC RANK
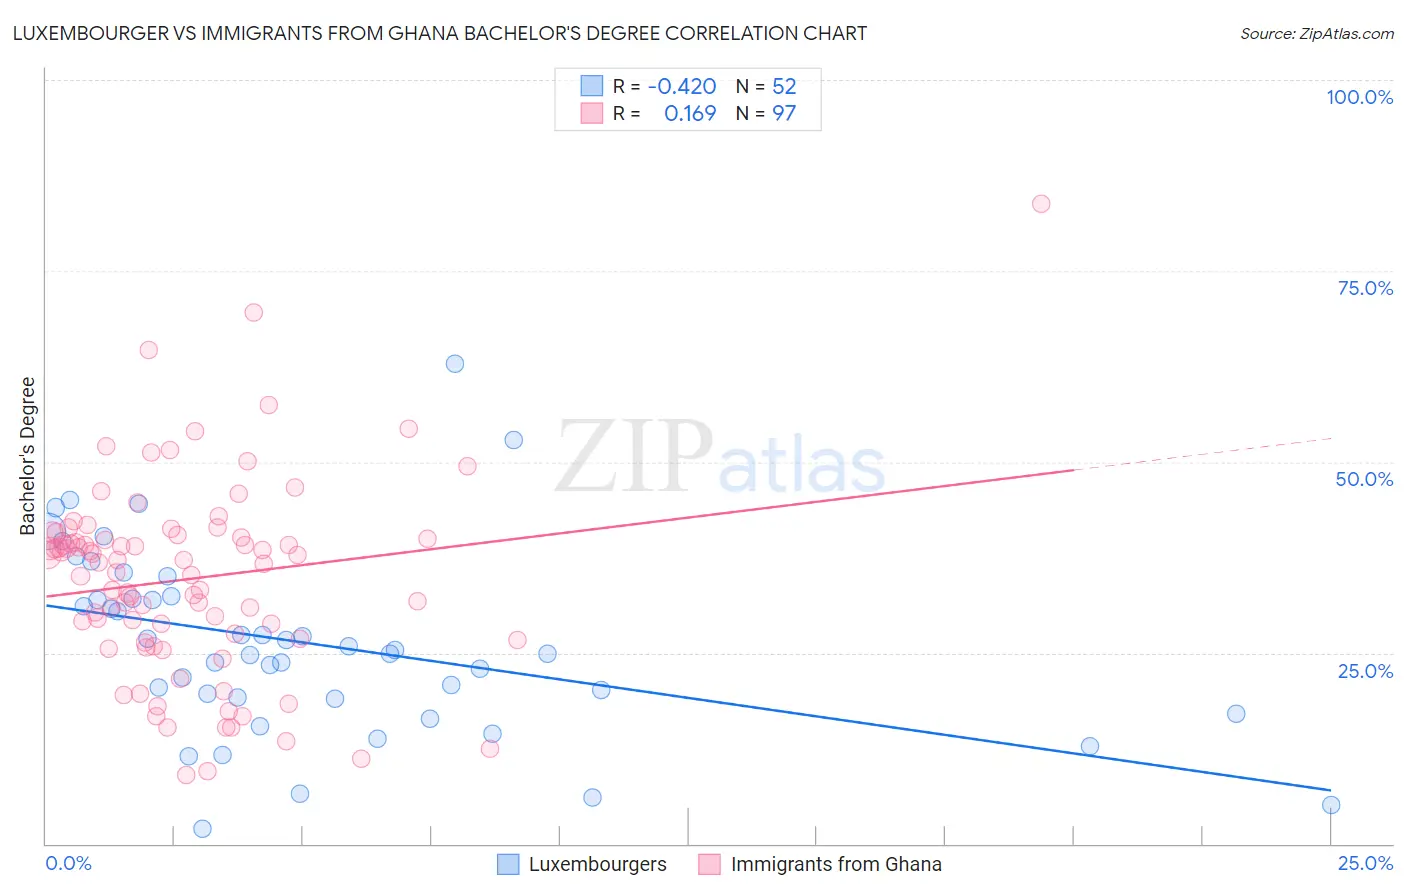
Luxembourger vs Immigrants from Ghana Bachelor's Degree Correlation Chart
The statistical analysis conducted on geographies consisting of 144,665,443 people shows a moderate negative correlation between the proportion of Luxembourgers and percentage of population with at least bachelor's degree education in the United States with a correlation coefficient (R) of -0.420 and weighted average of 39.8%. Similarly, the statistical analysis conducted on geographies consisting of 199,935,745 people shows a poor positive correlation between the proportion of Immigrants from Ghana and percentage of population with at least bachelor's degree education in the United States with a correlation coefficient (R) of 0.169 and weighted average of 36.9%, a difference of 7.7%.
Bachelor's Degree Correlation Summary
| Measurement | Luxembourger | Immigrants from Ghana |
| Minimum | 2.0% | 9.1% |
| Maximum | 62.9% | 83.8% |
| Range | 60.9% | 74.7% |
| Mean | 26.2% | 34.7% |
| Median | 25.1% | 36.8% |
| Interquartile 25% (IQ1) | 19.0% | 26.7% |
| Interquartile 75% (IQ3) | 32.2% | 40.3% |
| Interquartile Range (IQR) | 13.2% | 13.5% |
| Standard Deviation (Sample) | 12.2% | 12.8% |
| Standard Deviation (Population) | 12.1% | 12.7% |
Similar Demographics by Bachelor's Degree
Demographics Similar to Luxembourgers by Bachelor's Degree
In terms of bachelor's degree, the demographic groups most similar to Luxembourgers are Assyrian/Chaldean/Syriac (39.8%, a difference of 0.080%), Pakistani (39.7%, a difference of 0.20%), Immigrants from Southern Europe (40.0%, a difference of 0.51%), Taiwanese (40.0%, a difference of 0.52%), and Icelander (39.5%, a difference of 0.57%).
| Demographics | Rating | Rank | Bachelor's Degree |
| Immigrants | Venezuela | 92.9 /100 | #128 | Exceptional 40.2% |
| Serbians | 92.4 /100 | #129 | Exceptional 40.1% |
| Sierra Leoneans | 92.2 /100 | #130 | Exceptional 40.1% |
| Italians | 91.9 /100 | #131 | Exceptional 40.1% |
| Taiwanese | 91.1 /100 | #132 | Exceptional 40.0% |
| Immigrants | Southern Europe | 91.1 /100 | #133 | Exceptional 40.0% |
| Assyrians/Chaldeans/Syriacs | 89.4 /100 | #134 | Excellent 39.8% |
| Luxembourgers | 89.1 /100 | #135 | Excellent 39.8% |
| Pakistanis | 88.2 /100 | #136 | Excellent 39.7% |
| Icelanders | 86.5 /100 | #137 | Excellent 39.5% |
| Europeans | 85.6 /100 | #138 | Excellent 39.5% |
| Immigrants | Sudan | 84.5 /100 | #139 | Excellent 39.4% |
| Immigrants | Armenia | 84.1 /100 | #140 | Excellent 39.4% |
| South American Indians | 83.6 /100 | #141 | Excellent 39.3% |
| Immigrants | North Macedonia | 81.6 /100 | #142 | Excellent 39.2% |
Demographics Similar to Immigrants from Ghana by Bachelor's Degree
In terms of bachelor's degree, the demographic groups most similar to Immigrants from Ghana are Immigrants from Costa Rica (36.9%, a difference of 0.0%), Welsh (37.0%, a difference of 0.21%), Czechoslovakian (37.0%, a difference of 0.22%), Immigrants from South Eastern Asia (36.8%, a difference of 0.26%), and Celtic (37.0%, a difference of 0.27%).
| Demographics | Rating | Rank | Bachelor's Degree |
| Yugoslavians | 31.5 /100 | #193 | Fair 37.1% |
| Belgians | 29.9 /100 | #194 | Fair 37.0% |
| Koreans | 29.8 /100 | #195 | Fair 37.0% |
| Celtics | 29.5 /100 | #196 | Fair 37.0% |
| Czechoslovakians | 29.2 /100 | #197 | Fair 37.0% |
| Welsh | 29.1 /100 | #198 | Fair 37.0% |
| Immigrants | Costa Rica | 27.4 /100 | #199 | Fair 36.9% |
| Immigrants | Ghana | 27.4 /100 | #200 | Fair 36.9% |
| Immigrants | South Eastern Asia | 25.4 /100 | #201 | Fair 36.8% |
| Immigrants | Zaire | 25.3 /100 | #202 | Fair 36.8% |
| Immigrants | Nigeria | 23.1 /100 | #203 | Fair 36.7% |
| Immigrants | Immigrants | 22.8 /100 | #204 | Fair 36.7% |
| Finns | 22.2 /100 | #205 | Fair 36.7% |
| Spaniards | 21.2 /100 | #206 | Fair 36.6% |
| Immigrants | Middle Africa | 20.6 /100 | #207 | Fair 36.6% |