Luxembourger vs Egyptian Bachelor's Degree
COMPARE
Luxembourger
Egyptian
Bachelor's Degree
Bachelor's Degree Comparison
Luxembourgers
Egyptians
39.8%
BACHELOR'S DEGREE
89.1/ 100
METRIC RATING
135th/ 347
METRIC RANK
43.3%
BACHELOR'S DEGREE
99.7/ 100
METRIC RATING
67th/ 347
METRIC RANK
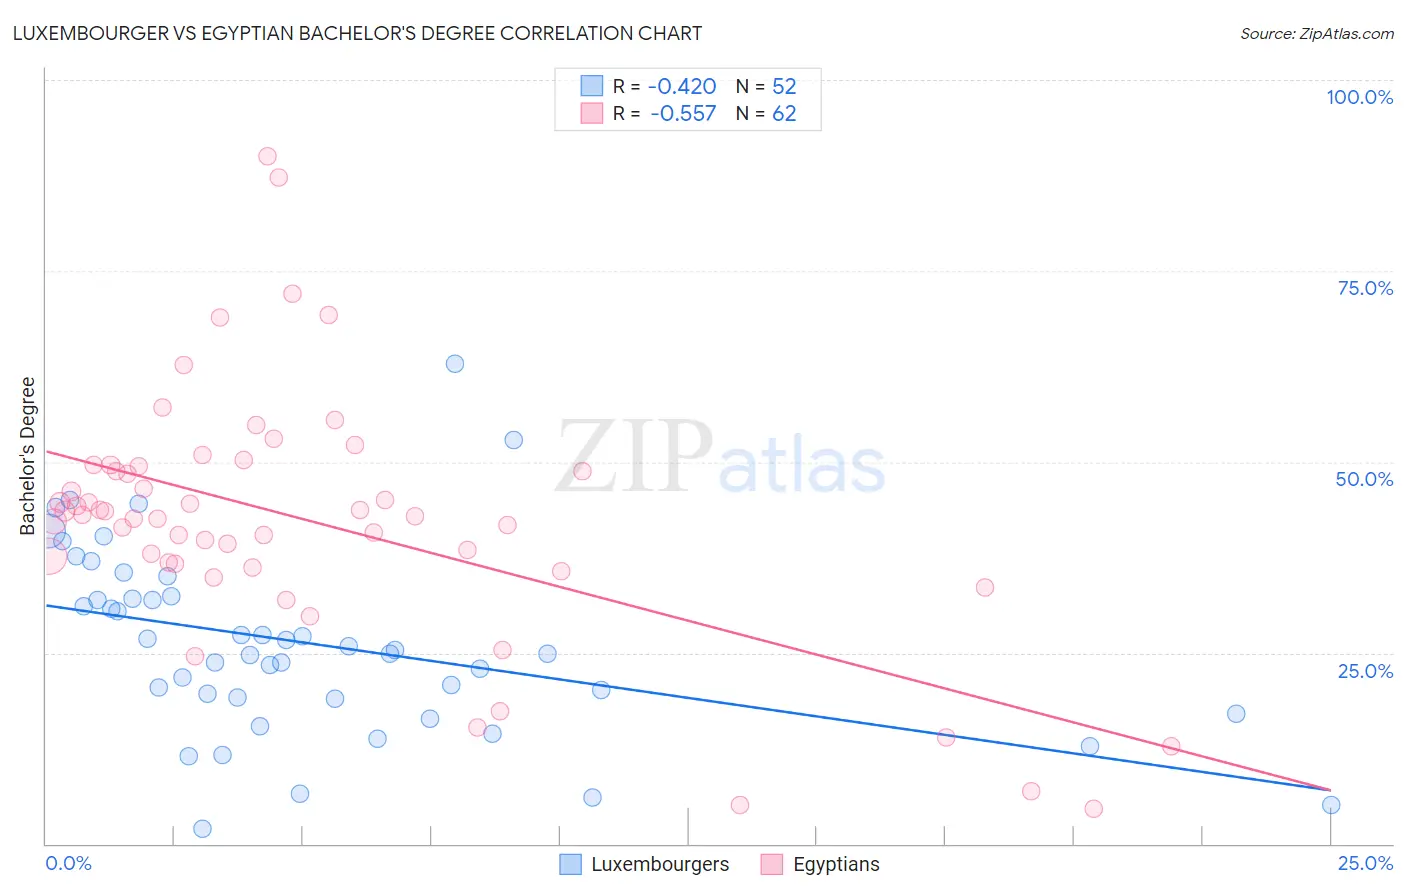
Luxembourger vs Egyptian Bachelor's Degree Correlation Chart
The statistical analysis conducted on geographies consisting of 144,665,443 people shows a moderate negative correlation between the proportion of Luxembourgers and percentage of population with at least bachelor's degree education in the United States with a correlation coefficient (R) of -0.420 and weighted average of 39.8%. Similarly, the statistical analysis conducted on geographies consisting of 276,908,448 people shows a substantial negative correlation between the proportion of Egyptians and percentage of population with at least bachelor's degree education in the United States with a correlation coefficient (R) of -0.557 and weighted average of 43.3%, a difference of 8.8%.
Bachelor's Degree Correlation Summary
| Measurement | Luxembourger | Egyptian |
| Minimum | 2.0% | 4.6% |
| Maximum | 62.9% | 90.0% |
| Range | 60.9% | 85.4% |
| Mean | 26.2% | 42.3% |
| Median | 25.1% | 43.0% |
| Interquartile 25% (IQ1) | 19.0% | 36.6% |
| Interquartile 75% (IQ3) | 32.2% | 49.5% |
| Interquartile Range (IQR) | 13.2% | 12.8% |
| Standard Deviation (Sample) | 12.2% | 16.5% |
| Standard Deviation (Population) | 12.1% | 16.3% |
Similar Demographics by Bachelor's Degree
Demographics Similar to Luxembourgers by Bachelor's Degree
In terms of bachelor's degree, the demographic groups most similar to Luxembourgers are Assyrian/Chaldean/Syriac (39.8%, a difference of 0.080%), Pakistani (39.7%, a difference of 0.20%), Immigrants from Southern Europe (40.0%, a difference of 0.51%), Taiwanese (40.0%, a difference of 0.52%), and Icelander (39.5%, a difference of 0.57%).
| Demographics | Rating | Rank | Bachelor's Degree |
| Immigrants | Venezuela | 92.9 /100 | #128 | Exceptional 40.2% |
| Serbians | 92.4 /100 | #129 | Exceptional 40.1% |
| Sierra Leoneans | 92.2 /100 | #130 | Exceptional 40.1% |
| Italians | 91.9 /100 | #131 | Exceptional 40.1% |
| Taiwanese | 91.1 /100 | #132 | Exceptional 40.0% |
| Immigrants | Southern Europe | 91.1 /100 | #133 | Exceptional 40.0% |
| Assyrians/Chaldeans/Syriacs | 89.4 /100 | #134 | Excellent 39.8% |
| Luxembourgers | 89.1 /100 | #135 | Excellent 39.8% |
| Pakistanis | 88.2 /100 | #136 | Excellent 39.7% |
| Icelanders | 86.5 /100 | #137 | Excellent 39.5% |
| Europeans | 85.6 /100 | #138 | Excellent 39.5% |
| Immigrants | Sudan | 84.5 /100 | #139 | Excellent 39.4% |
| Immigrants | Armenia | 84.1 /100 | #140 | Excellent 39.4% |
| South American Indians | 83.6 /100 | #141 | Excellent 39.3% |
| Immigrants | North Macedonia | 81.6 /100 | #142 | Excellent 39.2% |
Demographics Similar to Egyptians by Bachelor's Degree
In terms of bachelor's degree, the demographic groups most similar to Egyptians are Immigrants from Netherlands (43.3%, a difference of 0.020%), Immigrants from Indonesia (43.3%, a difference of 0.020%), Zimbabwean (43.3%, a difference of 0.040%), Argentinean (43.3%, a difference of 0.050%), and Immigrants from Pakistan (43.1%, a difference of 0.28%).
| Demographics | Rating | Rank | Bachelor's Degree |
| New Zealanders | 99.9 /100 | #60 | Exceptional 44.0% |
| South Africans | 99.8 /100 | #61 | Exceptional 43.6% |
| Immigrants | Kazakhstan | 99.8 /100 | #62 | Exceptional 43.4% |
| Immigrants | Europe | 99.8 /100 | #63 | Exceptional 43.4% |
| Argentineans | 99.7 /100 | #64 | Exceptional 43.3% |
| Zimbabweans | 99.7 /100 | #65 | Exceptional 43.3% |
| Immigrants | Netherlands | 99.7 /100 | #66 | Exceptional 43.3% |
| Egyptians | 99.7 /100 | #67 | Exceptional 43.3% |
| Immigrants | Indonesia | 99.7 /100 | #68 | Exceptional 43.3% |
| Immigrants | Pakistan | 99.7 /100 | #69 | Exceptional 43.1% |
| Immigrants | Romania | 99.6 /100 | #70 | Exceptional 42.9% |
| Immigrants | Argentina | 99.6 /100 | #71 | Exceptional 42.8% |
| Ethiopians | 99.5 /100 | #72 | Exceptional 42.8% |
| Immigrants | Uzbekistan | 99.5 /100 | #73 | Exceptional 42.8% |
| Bhutanese | 99.5 /100 | #74 | Exceptional 42.7% |