Tongan vs Immigrants from Ghana Bachelor's Degree
COMPARE
Tongan
Immigrants from Ghana
Bachelor's Degree
Bachelor's Degree Comparison
Tongans
Immigrants from Ghana
34.3%
BACHELOR'S DEGREE
2.0/ 100
METRIC RATING
240th/ 347
METRIC RANK
36.9%
BACHELOR'S DEGREE
27.4/ 100
METRIC RATING
200th/ 347
METRIC RANK
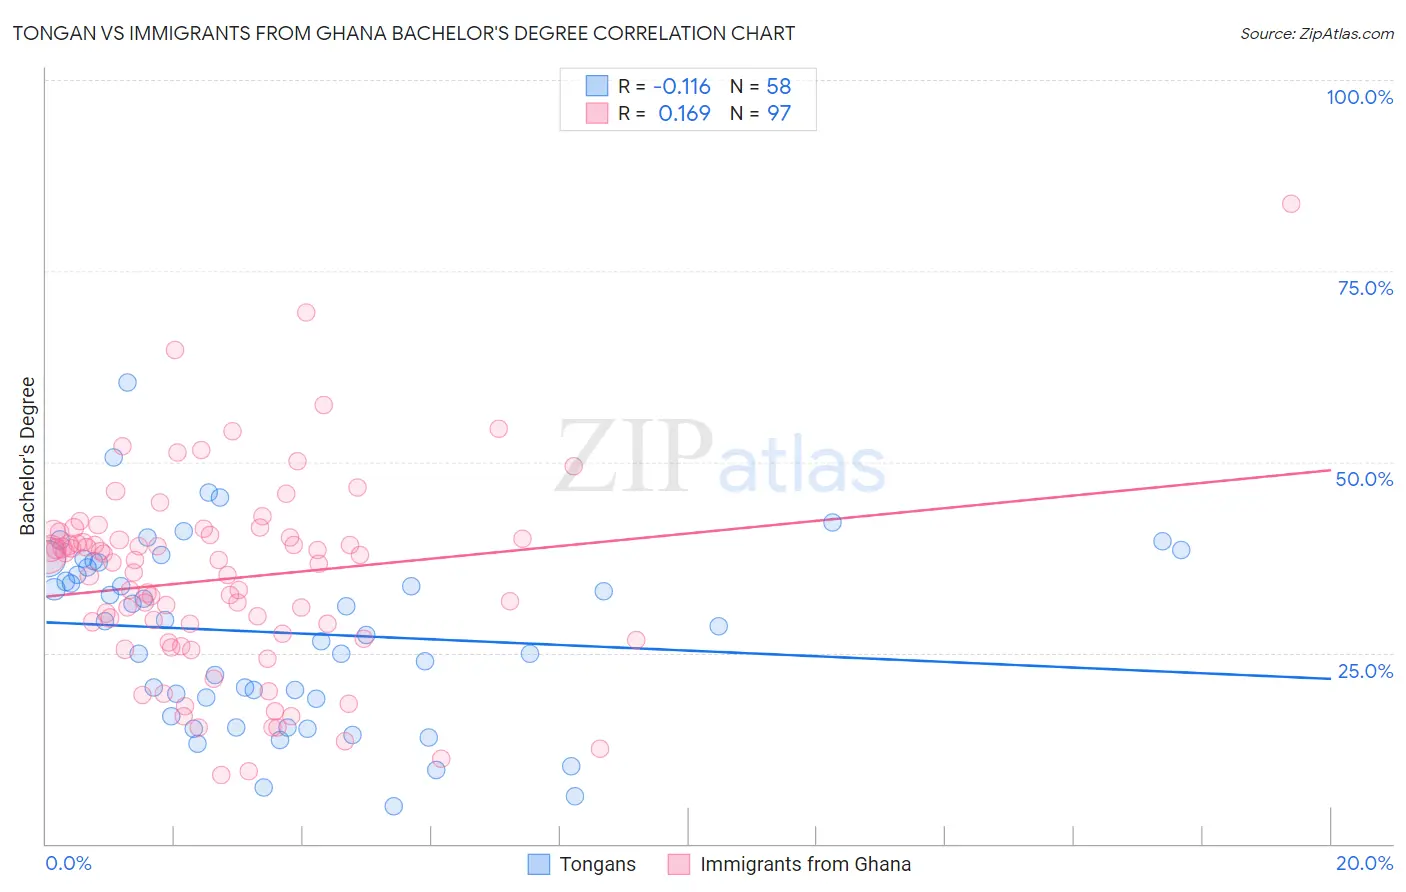
Tongan vs Immigrants from Ghana Bachelor's Degree Correlation Chart
The statistical analysis conducted on geographies consisting of 102,908,079 people shows a poor negative correlation between the proportion of Tongans and percentage of population with at least bachelor's degree education in the United States with a correlation coefficient (R) of -0.116 and weighted average of 34.3%. Similarly, the statistical analysis conducted on geographies consisting of 199,935,745 people shows a poor positive correlation between the proportion of Immigrants from Ghana and percentage of population with at least bachelor's degree education in the United States with a correlation coefficient (R) of 0.169 and weighted average of 36.9%, a difference of 7.8%.
Bachelor's Degree Correlation Summary
| Measurement | Tongan | Immigrants from Ghana |
| Minimum | 4.8% | 9.1% |
| Maximum | 60.4% | 83.8% |
| Range | 55.6% | 74.7% |
| Mean | 27.6% | 34.7% |
| Median | 28.7% | 36.8% |
| Interquartile 25% (IQ1) | 19.0% | 26.7% |
| Interquartile 75% (IQ3) | 36.8% | 40.3% |
| Interquartile Range (IQR) | 17.8% | 13.5% |
| Standard Deviation (Sample) | 11.9% | 12.8% |
| Standard Deviation (Population) | 11.8% | 12.7% |
Similar Demographics by Bachelor's Degree
Demographics Similar to Tongans by Bachelor's Degree
In terms of bachelor's degree, the demographic groups most similar to Tongans are Immigrants from Cambodia (34.2%, a difference of 0.26%), Nonimmigrants (34.2%, a difference of 0.33%), British West Indian (34.5%, a difference of 0.54%), Guyanese (34.5%, a difference of 0.56%), and Tlingit-Haida (34.6%, a difference of 0.84%).
| Demographics | Rating | Rank | Bachelor's Degree |
| Immigrants | Ecuador | 3.3 /100 | #233 | Tragic 34.7% |
| Guamanians/Chamorros | 3.0 /100 | #234 | Tragic 34.6% |
| Immigrants | West Indies | 2.9 /100 | #235 | Tragic 34.6% |
| Liberians | 2.8 /100 | #236 | Tragic 34.6% |
| Tlingit-Haida | 2.8 /100 | #237 | Tragic 34.6% |
| Guyanese | 2.5 /100 | #238 | Tragic 34.5% |
| British West Indians | 2.5 /100 | #239 | Tragic 34.5% |
| Tongans | 2.0 /100 | #240 | Tragic 34.3% |
| Immigrants | Cambodia | 1.9 /100 | #241 | Tragic 34.2% |
| Immigrants | Nonimmigrants | 1.8 /100 | #242 | Tragic 34.2% |
| Immigrants | Guyana | 1.4 /100 | #243 | Tragic 33.9% |
| Delaware | 1.2 /100 | #244 | Tragic 33.8% |
| Immigrants | Fiji | 1.2 /100 | #245 | Tragic 33.7% |
| Jamaicans | 1.0 /100 | #246 | Tragic 33.6% |
| Immigrants | Congo | 1.0 /100 | #247 | Tragic 33.6% |
Demographics Similar to Immigrants from Ghana by Bachelor's Degree
In terms of bachelor's degree, the demographic groups most similar to Immigrants from Ghana are Immigrants from Costa Rica (36.9%, a difference of 0.0%), Welsh (37.0%, a difference of 0.21%), Czechoslovakian (37.0%, a difference of 0.22%), Immigrants from South Eastern Asia (36.8%, a difference of 0.26%), and Celtic (37.0%, a difference of 0.27%).
| Demographics | Rating | Rank | Bachelor's Degree |
| Yugoslavians | 31.5 /100 | #193 | Fair 37.1% |
| Belgians | 29.9 /100 | #194 | Fair 37.0% |
| Koreans | 29.8 /100 | #195 | Fair 37.0% |
| Celtics | 29.5 /100 | #196 | Fair 37.0% |
| Czechoslovakians | 29.2 /100 | #197 | Fair 37.0% |
| Welsh | 29.1 /100 | #198 | Fair 37.0% |
| Immigrants | Costa Rica | 27.4 /100 | #199 | Fair 36.9% |
| Immigrants | Ghana | 27.4 /100 | #200 | Fair 36.9% |
| Immigrants | South Eastern Asia | 25.4 /100 | #201 | Fair 36.8% |
| Immigrants | Zaire | 25.3 /100 | #202 | Fair 36.8% |
| Immigrants | Nigeria | 23.1 /100 | #203 | Fair 36.7% |
| Immigrants | Immigrants | 22.8 /100 | #204 | Fair 36.7% |
| Finns | 22.2 /100 | #205 | Fair 36.7% |
| Spaniards | 21.2 /100 | #206 | Fair 36.6% |
| Immigrants | Middle Africa | 20.6 /100 | #207 | Fair 36.6% |