Welsh vs Immigrants from Germany Doctorate Degree
COMPARE
Welsh
Immigrants from Germany
Doctorate Degree
Doctorate Degree Comparison
Welsh
Immigrants from Germany
1.9%
DOCTORATE DEGREE
69.7/ 100
METRIC RATING
160th/ 347
METRIC RANK
2.1%
DOCTORATE DEGREE
97.3/ 100
METRIC RATING
108th/ 347
METRIC RANK
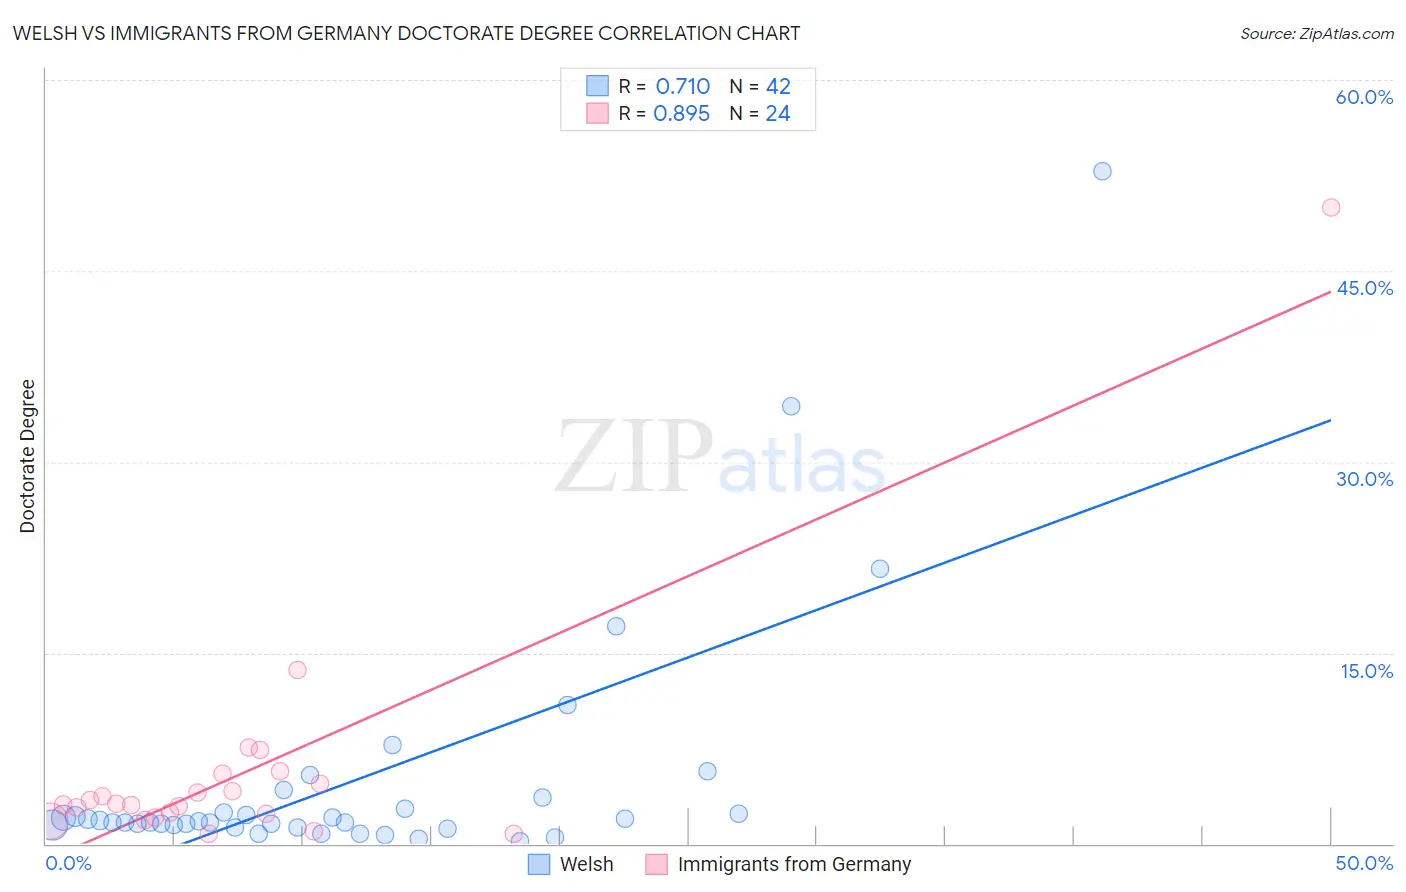
Welsh vs Immigrants from Germany Doctorate Degree Correlation Chart
The statistical analysis conducted on geographies consisting of 512,102,106 people shows a strong positive correlation between the proportion of Welsh and percentage of population with at least doctorate degree education in the United States with a correlation coefficient (R) of 0.710 and weighted average of 1.9%. Similarly, the statistical analysis conducted on geographies consisting of 457,324,098 people shows a very strong positive correlation between the proportion of Immigrants from Germany and percentage of population with at least doctorate degree education in the United States with a correlation coefficient (R) of 0.895 and weighted average of 2.1%, a difference of 9.8%.
Doctorate Degree Correlation Summary
| Measurement | Welsh | Immigrants from Germany |
| Minimum | 0.21% | 0.81% |
| Maximum | 52.8% | 50.0% |
| Range | 52.6% | 49.2% |
| Mean | 5.1% | 5.8% |
| Median | 1.7% | 3.1% |
| Interquartile 25% (IQ1) | 1.5% | 2.2% |
| Interquartile 75% (IQ3) | 2.7% | 5.1% |
| Interquartile Range (IQR) | 1.2% | 2.9% |
| Standard Deviation (Sample) | 9.9% | 9.8% |
| Standard Deviation (Population) | 9.8% | 9.6% |
Similar Demographics by Doctorate Degree
Demographics Similar to Welsh by Doctorate Degree
In terms of doctorate degree, the demographic groups most similar to Welsh are Slovene (1.9%, a difference of 0.090%), Immigrants from Middle Africa (1.9%, a difference of 0.15%), Hungarian (1.9%, a difference of 0.35%), Irish (1.9%, a difference of 0.36%), and Danish (1.9%, a difference of 0.38%).
| Demographics | Rating | Rank | Doctorate Degree |
| Immigrants | Oceania | 74.0 /100 | #153 | Good 1.9% |
| Immigrants | Albania | 72.8 /100 | #154 | Good 1.9% |
| Poles | 72.7 /100 | #155 | Good 1.9% |
| Slavs | 72.4 /100 | #156 | Good 1.9% |
| Danes | 71.9 /100 | #157 | Good 1.9% |
| Hungarians | 71.7 /100 | #158 | Good 1.9% |
| Slovenes | 70.2 /100 | #159 | Good 1.9% |
| Welsh | 69.7 /100 | #160 | Good 1.9% |
| Immigrants | Middle Africa | 68.8 /100 | #161 | Good 1.9% |
| Irish | 67.5 /100 | #162 | Good 1.9% |
| Czechs | 67.3 /100 | #163 | Good 1.9% |
| Celtics | 66.7 /100 | #164 | Good 1.9% |
| Scotch-Irish | 63.6 /100 | #165 | Good 1.9% |
| Spaniards | 63.5 /100 | #166 | Good 1.9% |
| Macedonians | 60.9 /100 | #167 | Good 1.9% |
Demographics Similar to Immigrants from Germany by Doctorate Degree
In terms of doctorate degree, the demographic groups most similar to Immigrants from Germany are Ukrainian (2.1%, a difference of 0.060%), Brazilian (2.1%, a difference of 0.13%), Immigrants from Pakistan (2.1%, a difference of 0.19%), Syrian (2.1%, a difference of 0.21%), and European (2.1%, a difference of 0.22%).
| Demographics | Rating | Rank | Doctorate Degree |
| Immigrants | Eastern Africa | 98.2 /100 | #101 | Exceptional 2.1% |
| Immigrants | Chile | 98.1 /100 | #102 | Exceptional 2.1% |
| Romanians | 98.1 /100 | #103 | Exceptional 2.1% |
| Austrians | 98.0 /100 | #104 | Exceptional 2.1% |
| Arabs | 97.8 /100 | #105 | Exceptional 2.1% |
| Sudanese | 97.7 /100 | #106 | Exceptional 2.1% |
| Europeans | 97.5 /100 | #107 | Exceptional 2.1% |
| Immigrants | Germany | 97.3 /100 | #108 | Exceptional 2.1% |
| Ukrainians | 97.2 /100 | #109 | Exceptional 2.1% |
| Brazilians | 97.2 /100 | #110 | Exceptional 2.1% |
| Immigrants | Pakistan | 97.1 /100 | #111 | Exceptional 2.1% |
| Syrians | 97.1 /100 | #112 | Exceptional 2.1% |
| Immigrants | Italy | 96.9 /100 | #113 | Exceptional 2.1% |
| Immigrants | Croatia | 96.8 /100 | #114 | Exceptional 2.1% |
| Taiwanese | 96.7 /100 | #115 | Exceptional 2.1% |