Kiowa vs Cape Verdean GED/Equivalency
COMPARE
Kiowa
Cape Verdean
GED/Equivalency
GED/Equivalency Comparison
Kiowa
Cape Verdeans
83.1%
GED/EQUIVALENCY
0.2/ 100
METRIC RATING
266th/ 347
METRIC RANK
80.9%
GED/EQUIVALENCY
0.0/ 100
METRIC RATING
313th/ 347
METRIC RANK
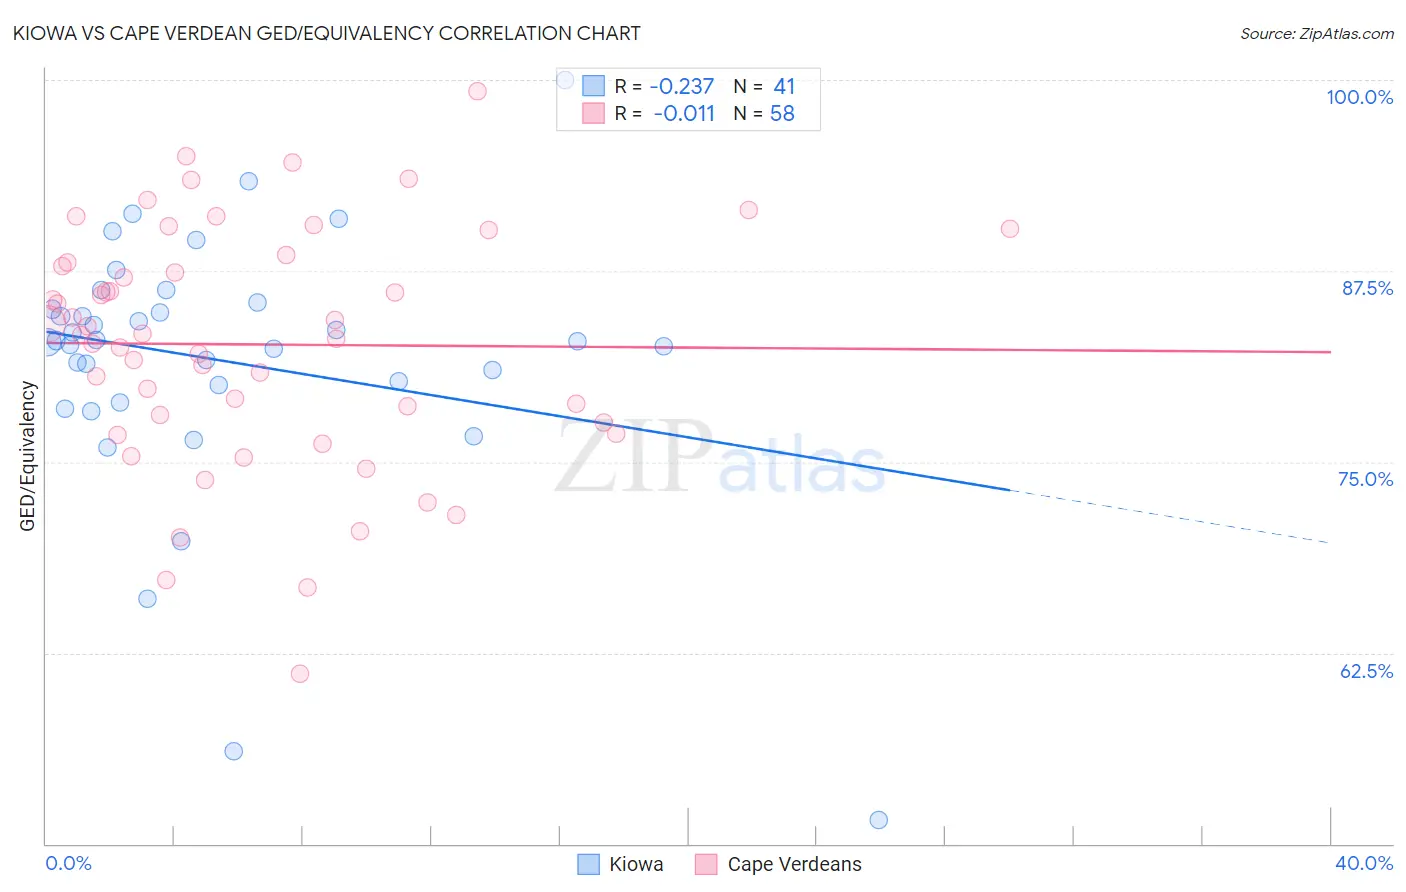
Kiowa vs Cape Verdean GED/Equivalency Correlation Chart
The statistical analysis conducted on geographies consisting of 56,101,840 people shows a weak negative correlation between the proportion of Kiowa and percentage of population with at least ged/equivalency education in the United States with a correlation coefficient (R) of -0.237 and weighted average of 83.1%. Similarly, the statistical analysis conducted on geographies consisting of 107,537,955 people shows no correlation between the proportion of Cape Verdeans and percentage of population with at least ged/equivalency education in the United States with a correlation coefficient (R) of -0.011 and weighted average of 80.9%, a difference of 2.6%.
GED/Equivalency Correlation Summary
| Measurement | Kiowa | Cape Verdean |
| Minimum | 51.6% | 61.1% |
| Maximum | 100.0% | 99.3% |
| Range | 48.4% | 38.1% |
| Mean | 81.7% | 82.7% |
| Median | 82.9% | 83.4% |
| Interquartile 25% (IQ1) | 79.5% | 77.6% |
| Interquartile 75% (IQ3) | 85.2% | 88.1% |
| Interquartile Range (IQR) | 5.8% | 10.5% |
| Standard Deviation (Sample) | 8.7% | 7.9% |
| Standard Deviation (Population) | 8.6% | 7.8% |
Similar Demographics by GED/Equivalency
Demographics Similar to Kiowa by GED/Equivalency
In terms of ged/equivalency, the demographic groups most similar to Kiowa are Bangladeshi (83.1%, a difference of 0.010%), West Indian (83.1%, a difference of 0.010%), Trinidadian and Tobagonian (83.0%, a difference of 0.020%), Immigrants from Congo (83.1%, a difference of 0.030%), and Inupiat (83.1%, a difference of 0.040%).
| Demographics | Rating | Rank | GED/Equivalency |
| Immigrants | Vietnam | 0.3 /100 | #259 | Tragic 83.2% |
| Choctaw | 0.3 /100 | #260 | Tragic 83.1% |
| Inupiat | 0.2 /100 | #261 | Tragic 83.1% |
| Immigrants | Armenia | 0.2 /100 | #262 | Tragic 83.1% |
| Immigrants | Congo | 0.2 /100 | #263 | Tragic 83.1% |
| Bangladeshis | 0.2 /100 | #264 | Tragic 83.1% |
| West Indians | 0.2 /100 | #265 | Tragic 83.1% |
| Kiowa | 0.2 /100 | #266 | Tragic 83.1% |
| Trinidadians and Tobagonians | 0.2 /100 | #267 | Tragic 83.0% |
| Immigrants | Burma/Myanmar | 0.2 /100 | #268 | Tragic 83.0% |
| Hopi | 0.2 /100 | #269 | Tragic 83.0% |
| Immigrants | Jamaica | 0.2 /100 | #270 | Tragic 82.9% |
| U.S. Virgin Islanders | 0.2 /100 | #271 | Tragic 82.9% |
| Barbadians | 0.1 /100 | #272 | Tragic 82.9% |
| Pennsylvania Germans | 0.1 /100 | #273 | Tragic 82.9% |
Demographics Similar to Cape Verdeans by GED/Equivalency
In terms of ged/equivalency, the demographic groups most similar to Cape Verdeans are Nicaraguan (80.9%, a difference of 0.0%), Belizean (80.9%, a difference of 0.020%), Immigrants from Guyana (81.0%, a difference of 0.040%), Native/Alaskan (80.9%, a difference of 0.040%), and Immigrants from Ecuador (81.0%, a difference of 0.10%).
| Demographics | Rating | Rank | GED/Equivalency |
| Guyanese | 0.0 /100 | #306 | Tragic 81.3% |
| Immigrants | Dominica | 0.0 /100 | #307 | Tragic 81.1% |
| Puerto Ricans | 0.0 /100 | #308 | Tragic 81.1% |
| Immigrants | Ecuador | 0.0 /100 | #309 | Tragic 81.0% |
| Immigrants | Guyana | 0.0 /100 | #310 | Tragic 81.0% |
| Natives/Alaskans | 0.0 /100 | #311 | Tragic 80.9% |
| Nicaraguans | 0.0 /100 | #312 | Tragic 80.9% |
| Cape Verdeans | 0.0 /100 | #313 | Tragic 80.9% |
| Belizeans | 0.0 /100 | #314 | Tragic 80.9% |
| Apache | 0.0 /100 | #315 | Tragic 80.7% |
| Central American Indians | 0.0 /100 | #316 | Tragic 80.6% |
| Immigrants | Caribbean | 0.0 /100 | #317 | Tragic 80.5% |
| Yaqui | 0.0 /100 | #318 | Tragic 80.5% |
| Immigrants | Belize | 0.0 /100 | #319 | Tragic 80.5% |
| Immigrants | Cuba | 0.0 /100 | #320 | Tragic 80.2% |