Jordanian vs Immigrants from Liberia High School Diploma
COMPARE
Jordanian
Immigrants from Liberia
High School Diploma
High School Diploma Comparison
Jordanians
Immigrants from Liberia
90.2%
HIGH SCHOOL DIPLOMA
95.4/ 100
METRIC RATING
117th/ 347
METRIC RANK
88.2%
HIGH SCHOOL DIPLOMA
5.5/ 100
METRIC RATING
227th/ 347
METRIC RANK
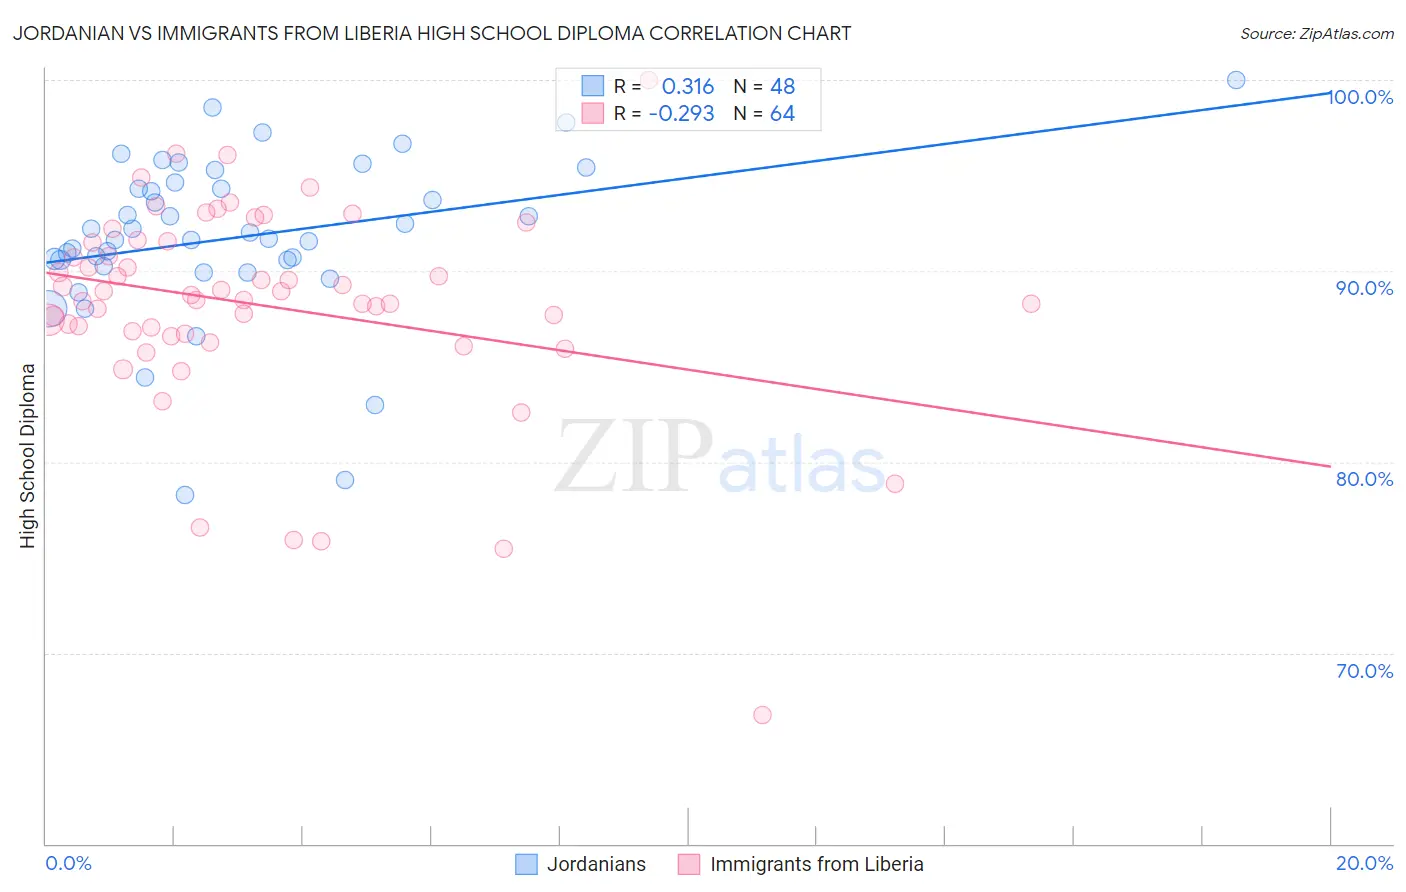
Jordanian vs Immigrants from Liberia High School Diploma Correlation Chart
The statistical analysis conducted on geographies consisting of 166,423,935 people shows a mild positive correlation between the proportion of Jordanians and percentage of population with at least high school diploma education in the United States with a correlation coefficient (R) of 0.316 and weighted average of 90.2%. Similarly, the statistical analysis conducted on geographies consisting of 135,293,967 people shows a weak negative correlation between the proportion of Immigrants from Liberia and percentage of population with at least high school diploma education in the United States with a correlation coefficient (R) of -0.293 and weighted average of 88.2%, a difference of 2.2%.
High School Diploma Correlation Summary
| Measurement | Jordanian | Immigrants from Liberia |
| Minimum | 78.2% | 66.8% |
| Maximum | 100.0% | 100.0% |
| Range | 21.8% | 33.2% |
| Mean | 91.8% | 88.2% |
| Median | 91.9% | 88.6% |
| Interquartile 25% (IQ1) | 90.4% | 86.8% |
| Interquartile 75% (IQ3) | 94.5% | 91.5% |
| Interquartile Range (IQR) | 4.1% | 4.7% |
| Standard Deviation (Sample) | 4.4% | 5.5% |
| Standard Deviation (Population) | 4.3% | 5.4% |
Similar Demographics by High School Diploma
Demographics Similar to Jordanians by High School Diploma
In terms of high school diploma, the demographic groups most similar to Jordanians are Israeli (90.1%, a difference of 0.020%), Immigrants from Germany (90.2%, a difference of 0.030%), Immigrants from Hungary (90.2%, a difference of 0.040%), Immigrants from Eastern Europe (90.1%, a difference of 0.040%), and Ottawa (90.1%, a difference of 0.070%).
| Demographics | Rating | Rank | High School Diploma |
| Immigrants | Greece | 96.6 /100 | #110 | Exceptional 90.3% |
| Menominee | 96.6 /100 | #111 | Exceptional 90.3% |
| Immigrants | Belarus | 96.4 /100 | #112 | Exceptional 90.2% |
| Immigrants | Sri Lanka | 96.3 /100 | #113 | Exceptional 90.2% |
| Yugoslavians | 96.2 /100 | #114 | Exceptional 90.2% |
| Immigrants | Hungary | 95.8 /100 | #115 | Exceptional 90.2% |
| Immigrants | Germany | 95.7 /100 | #116 | Exceptional 90.2% |
| Jordanians | 95.4 /100 | #117 | Exceptional 90.2% |
| Israelis | 95.1 /100 | #118 | Exceptional 90.1% |
| Immigrants | Eastern Europe | 94.9 /100 | #119 | Exceptional 90.1% |
| Ottawa | 94.4 /100 | #120 | Exceptional 90.1% |
| Whites/Caucasians | 94.1 /100 | #121 | Exceptional 90.1% |
| Immigrants | Kazakhstan | 93.4 /100 | #122 | Exceptional 90.0% |
| German Russians | 92.0 /100 | #123 | Exceptional 90.0% |
| Mongolians | 91.6 /100 | #124 | Exceptional 89.9% |
Demographics Similar to Immigrants from Liberia by High School Diploma
In terms of high school diploma, the demographic groups most similar to Immigrants from Liberia are Uruguayan (88.2%, a difference of 0.010%), Kiowa (88.2%, a difference of 0.010%), Nigerian (88.2%, a difference of 0.020%), Creek (88.3%, a difference of 0.090%), and Shoshone (88.3%, a difference of 0.10%).
| Demographics | Rating | Rank | High School Diploma |
| Tongans | 9.5 /100 | #220 | Tragic 88.4% |
| Immigrants | Afghanistan | 8.6 /100 | #221 | Tragic 88.3% |
| Colville | 7.8 /100 | #222 | Tragic 88.3% |
| Immigrants | Zaire | 7.6 /100 | #223 | Tragic 88.3% |
| Shoshone | 7.0 /100 | #224 | Tragic 88.3% |
| Creek | 6.9 /100 | #225 | Tragic 88.3% |
| Uruguayans | 5.6 /100 | #226 | Tragic 88.2% |
| Immigrants | Liberia | 5.5 /100 | #227 | Tragic 88.2% |
| Kiowa | 5.3 /100 | #228 | Tragic 88.2% |
| Nigerians | 5.2 /100 | #229 | Tragic 88.2% |
| Blackfeet | 4.2 /100 | #230 | Tragic 88.1% |
| Colombians | 3.8 /100 | #231 | Tragic 88.1% |
| Immigrants | Middle Africa | 3.4 /100 | #232 | Tragic 88.0% |
| Immigrants | Panama | 3.1 /100 | #233 | Tragic 88.0% |
| Immigrants | Thailand | 3.1 /100 | #234 | Tragic 88.0% |