Iroquois vs Chickasaw Doctorate Degree
COMPARE
Iroquois
Chickasaw
Doctorate Degree
Doctorate Degree Comparison
Iroquois
Chickasaw
1.6%
DOCTORATE DEGREE
2.7/ 100
METRIC RATING
237th/ 347
METRIC RANK
1.5%
DOCTORATE DEGREE
0.7/ 100
METRIC RATING
262nd/ 347
METRIC RANK
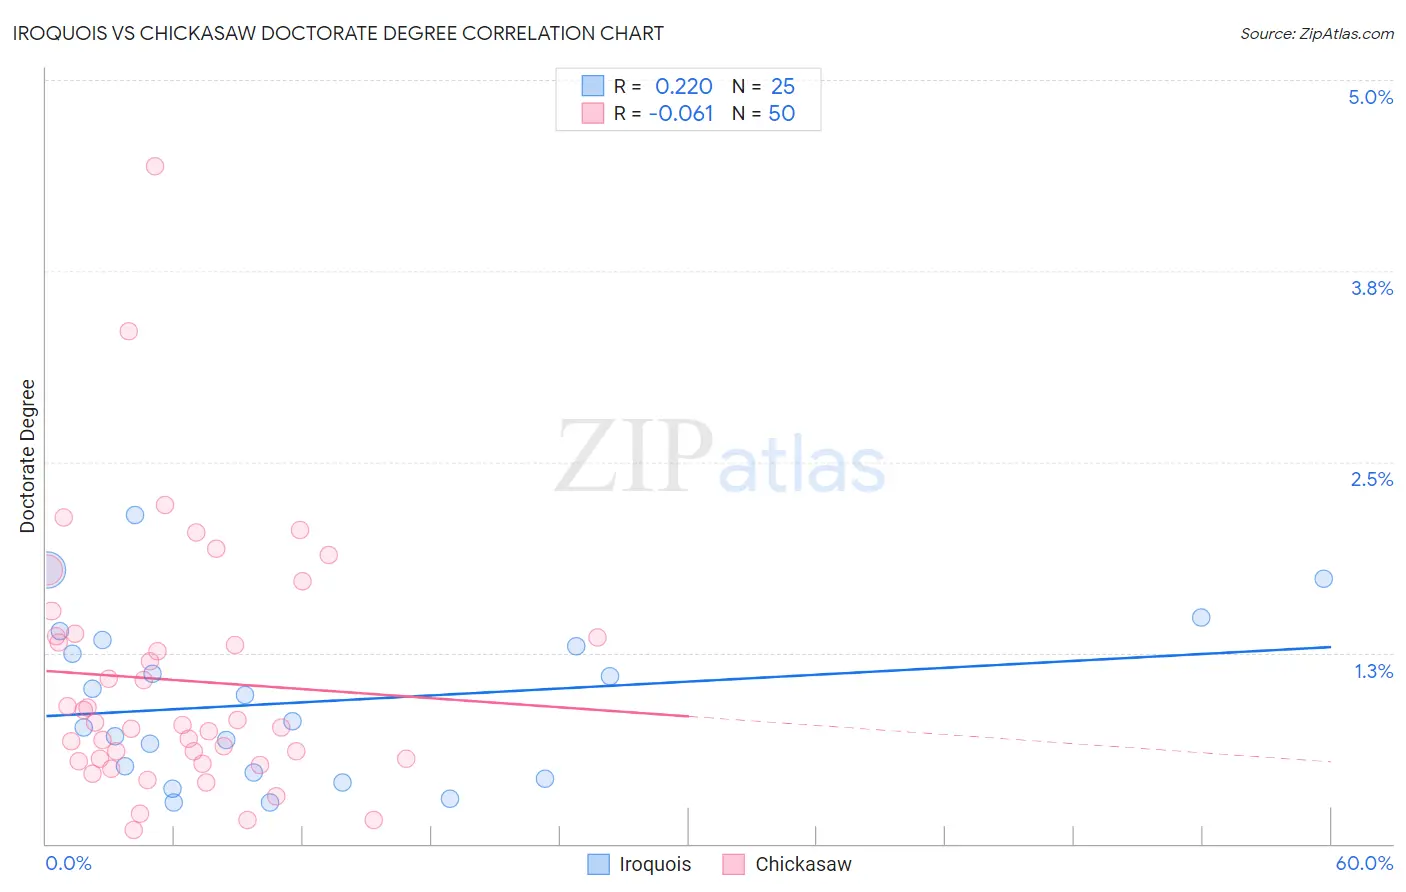
Iroquois vs Chickasaw Doctorate Degree Correlation Chart
The statistical analysis conducted on geographies consisting of 205,583,939 people shows a weak positive correlation between the proportion of Iroquois and percentage of population with at least doctorate degree education in the United States with a correlation coefficient (R) of 0.220 and weighted average of 1.6%. Similarly, the statistical analysis conducted on geographies consisting of 146,327,093 people shows a slight negative correlation between the proportion of Chickasaw and percentage of population with at least doctorate degree education in the United States with a correlation coefficient (R) of -0.061 and weighted average of 1.5%, a difference of 5.8%.
Doctorate Degree Correlation Summary
| Measurement | Iroquois | Chickasaw |
| Minimum | 0.27% | 0.090% |
| Maximum | 2.1% | 4.4% |
| Range | 1.9% | 4.3% |
| Mean | 0.93% | 1.1% |
| Median | 0.80% | 0.79% |
| Interquartile 25% (IQ1) | 0.44% | 0.56% |
| Interquartile 75% (IQ3) | 1.3% | 1.4% |
| Interquartile Range (IQR) | 0.87% | 0.80% |
| Standard Deviation (Sample) | 0.53% | 0.82% |
| Standard Deviation (Population) | 0.51% | 0.81% |
Similar Demographics by Doctorate Degree
Demographics Similar to Iroquois by Doctorate Degree
In terms of doctorate degree, the demographic groups most similar to Iroquois are Indonesian (1.6%, a difference of 0.19%), Immigrants from Congo (1.6%, a difference of 0.20%), West Indian (1.6%, a difference of 0.31%), Cree (1.6%, a difference of 0.47%), and Immigrants from Panama (1.6%, a difference of 0.50%).
| Demographics | Rating | Rank | Doctorate Degree |
| Immigrants | Philippines | 4.3 /100 | #230 | Tragic 1.6% |
| Immigrants | North Macedonia | 3.9 /100 | #231 | Tragic 1.6% |
| Guamanians/Chamorros | 3.3 /100 | #232 | Tragic 1.6% |
| Barbadians | 3.3 /100 | #233 | Tragic 1.6% |
| Hopi | 3.2 /100 | #234 | Tragic 1.6% |
| Cree | 3.0 /100 | #235 | Tragic 1.6% |
| Indonesians | 2.8 /100 | #236 | Tragic 1.6% |
| Iroquois | 2.7 /100 | #237 | Tragic 1.6% |
| Immigrants | Congo | 2.6 /100 | #238 | Tragic 1.6% |
| West Indians | 2.5 /100 | #239 | Tragic 1.6% |
| Immigrants | Panama | 2.4 /100 | #240 | Tragic 1.6% |
| Cheyenne | 2.3 /100 | #241 | Tragic 1.6% |
| Ottawa | 2.2 /100 | #242 | Tragic 1.6% |
| Native Hawaiians | 2.1 /100 | #243 | Tragic 1.6% |
| French American Indians | 2.0 /100 | #244 | Tragic 1.6% |
Demographics Similar to Chickasaw by Doctorate Degree
In terms of doctorate degree, the demographic groups most similar to Chickasaw are Immigrants from Portugal (1.5%, a difference of 0.15%), Immigrants from Bahamas (1.5%, a difference of 0.17%), Blackfeet (1.5%, a difference of 0.36%), Japanese (1.5%, a difference of 0.61%), and Nicaraguan (1.5%, a difference of 0.64%).
| Demographics | Rating | Rank | Doctorate Degree |
| Trinidadians and Tobagonians | 1.0 /100 | #255 | Tragic 1.5% |
| Central American Indians | 1.0 /100 | #256 | Tragic 1.5% |
| Chippewa | 0.9 /100 | #257 | Tragic 1.5% |
| Immigrants | West Indies | 0.9 /100 | #258 | Tragic 1.5% |
| Liberians | 0.9 /100 | #259 | Tragic 1.5% |
| Japanese | 0.9 /100 | #260 | Tragic 1.5% |
| Immigrants | Portugal | 0.8 /100 | #261 | Tragic 1.5% |
| Chickasaw | 0.7 /100 | #262 | Tragic 1.5% |
| Immigrants | Bahamas | 0.7 /100 | #263 | Tragic 1.5% |
| Blackfeet | 0.7 /100 | #264 | Tragic 1.5% |
| Nicaraguans | 0.6 /100 | #265 | Tragic 1.5% |
| Immigrants | Liberia | 0.5 /100 | #266 | Tragic 1.5% |
| Kiowa | 0.5 /100 | #267 | Tragic 1.5% |
| U.S. Virgin Islanders | 0.5 /100 | #268 | Tragic 1.5% |
| Crow | 0.5 /100 | #269 | Tragic 1.5% |