British West Indian vs Chickasaw Doctorate Degree
COMPARE
British West Indian
Chickasaw
Doctorate Degree
Doctorate Degree Comparison
British West Indians
Chickasaw
1.5%
DOCTORATE DEGREE
0.3/ 100
METRIC RATING
282nd/ 347
METRIC RANK
1.5%
DOCTORATE DEGREE
0.7/ 100
METRIC RATING
262nd/ 347
METRIC RANK
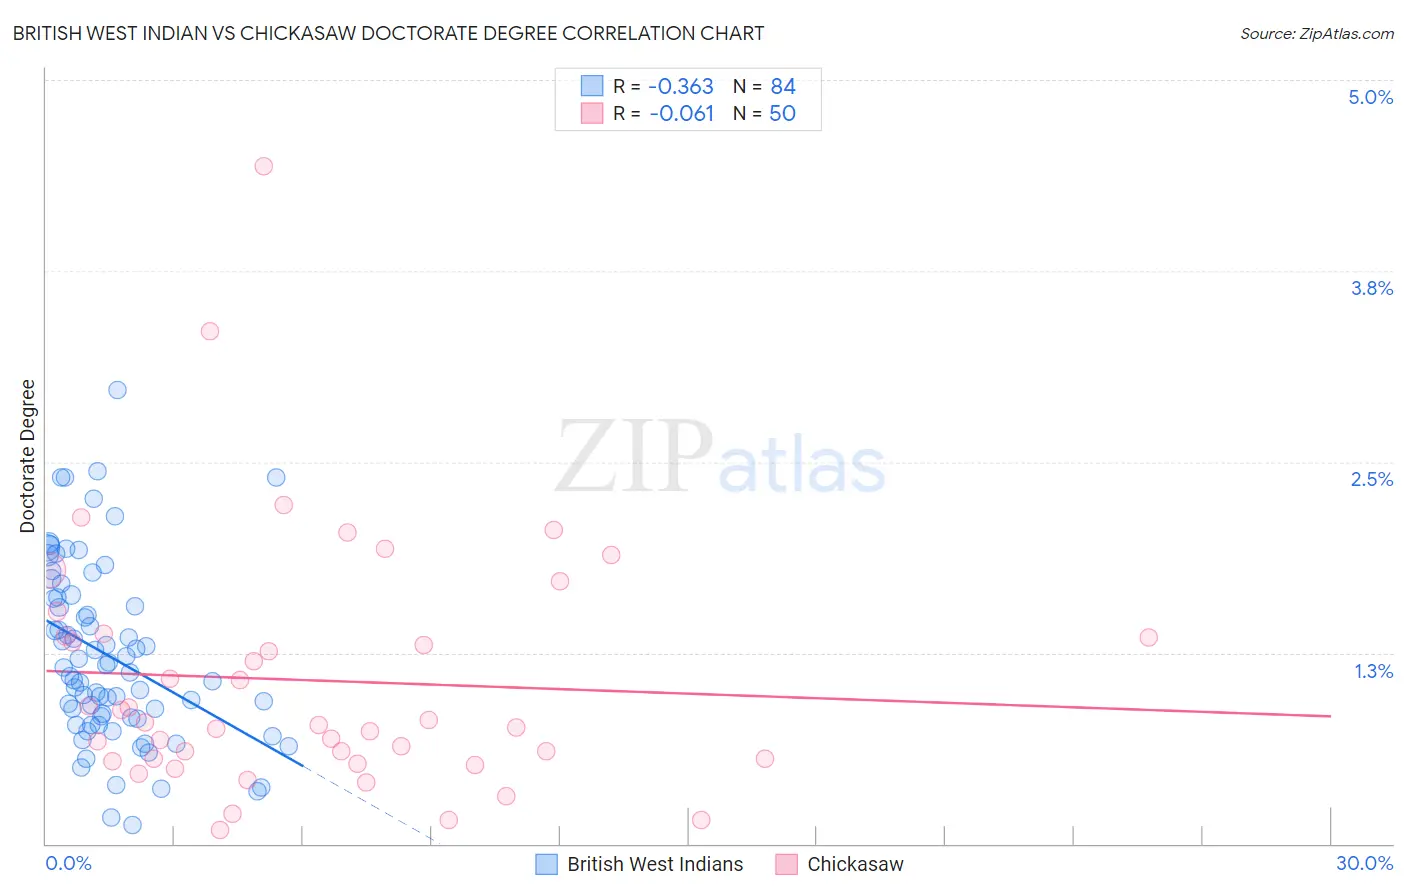
British West Indian vs Chickasaw Doctorate Degree Correlation Chart
The statistical analysis conducted on geographies consisting of 152,241,943 people shows a mild negative correlation between the proportion of British West Indians and percentage of population with at least doctorate degree education in the United States with a correlation coefficient (R) of -0.363 and weighted average of 1.5%. Similarly, the statistical analysis conducted on geographies consisting of 146,327,093 people shows a slight negative correlation between the proportion of Chickasaw and percentage of population with at least doctorate degree education in the United States with a correlation coefficient (R) of -0.061 and weighted average of 1.5%, a difference of 3.6%.
Doctorate Degree Correlation Summary
| Measurement | British West Indian | Chickasaw |
| Minimum | 0.12% | 0.090% |
| Maximum | 3.0% | 4.4% |
| Range | 2.8% | 4.3% |
| Mean | 1.2% | 1.1% |
| Median | 1.1% | 0.79% |
| Interquartile 25% (IQ1) | 0.82% | 0.56% |
| Interquartile 75% (IQ3) | 1.6% | 1.4% |
| Interquartile Range (IQR) | 0.79% | 0.80% |
| Standard Deviation (Sample) | 0.58% | 0.82% |
| Standard Deviation (Population) | 0.58% | 0.81% |
Demographics Similar to British West Indians and Chickasaw by Doctorate Degree
In terms of doctorate degree, the demographic groups most similar to British West Indians are Tohono O'odham (1.5%, a difference of 0.050%), Ecuadorian (1.5%, a difference of 0.12%), Marshallese (1.5%, a difference of 0.13%), Hawaiian (1.5%, a difference of 0.35%), and Bahamian (1.5%, a difference of 0.41%). Similarly, the demographic groups most similar to Chickasaw are Immigrants from Bahamas (1.5%, a difference of 0.17%), Blackfeet (1.5%, a difference of 0.36%), Nicaraguan (1.5%, a difference of 0.64%), Immigrants from Liberia (1.5%, a difference of 1.4%), and Kiowa (1.5%, a difference of 2.1%).
| Demographics | Rating | Rank | Doctorate Degree |
| Chickasaw | 0.7 /100 | #262 | Tragic 1.5% |
| Immigrants | Bahamas | 0.7 /100 | #263 | Tragic 1.5% |
| Blackfeet | 0.7 /100 | #264 | Tragic 1.5% |
| Nicaraguans | 0.6 /100 | #265 | Tragic 1.5% |
| Immigrants | Liberia | 0.5 /100 | #266 | Tragic 1.5% |
| Kiowa | 0.5 /100 | #267 | Tragic 1.5% |
| U.S. Virgin Islanders | 0.5 /100 | #268 | Tragic 1.5% |
| Crow | 0.5 /100 | #269 | Tragic 1.5% |
| Salvadorans | 0.5 /100 | #270 | Tragic 1.5% |
| Immigrants | Trinidad and Tobago | 0.5 /100 | #271 | Tragic 1.5% |
| Immigrants | Barbados | 0.4 /100 | #272 | Tragic 1.5% |
| Sioux | 0.4 /100 | #273 | Tragic 1.5% |
| Yaqui | 0.4 /100 | #274 | Tragic 1.5% |
| Aleuts | 0.4 /100 | #275 | Tragic 1.5% |
| Paiute | 0.4 /100 | #276 | Tragic 1.5% |
| Bahamians | 0.4 /100 | #277 | Tragic 1.5% |
| Hawaiians | 0.4 /100 | #278 | Tragic 1.5% |
| Marshallese | 0.4 /100 | #279 | Tragic 1.5% |
| Ecuadorians | 0.4 /100 | #280 | Tragic 1.5% |
| Tohono O'odham | 0.4 /100 | #281 | Tragic 1.5% |
| British West Indians | 0.3 /100 | #282 | Tragic 1.5% |