Iraqi vs Immigrants from Lithuania Bachelor's Degree
COMPARE
Iraqi
Immigrants from Lithuania
Bachelor's Degree
Bachelor's Degree Comparison
Iraqis
Immigrants from Lithuania
39.0%
BACHELOR'S DEGREE
78.1/ 100
METRIC RATING
148th/ 347
METRIC RANK
44.6%
BACHELOR'S DEGREE
99.9/ 100
METRIC RATING
44th/ 347
METRIC RANK
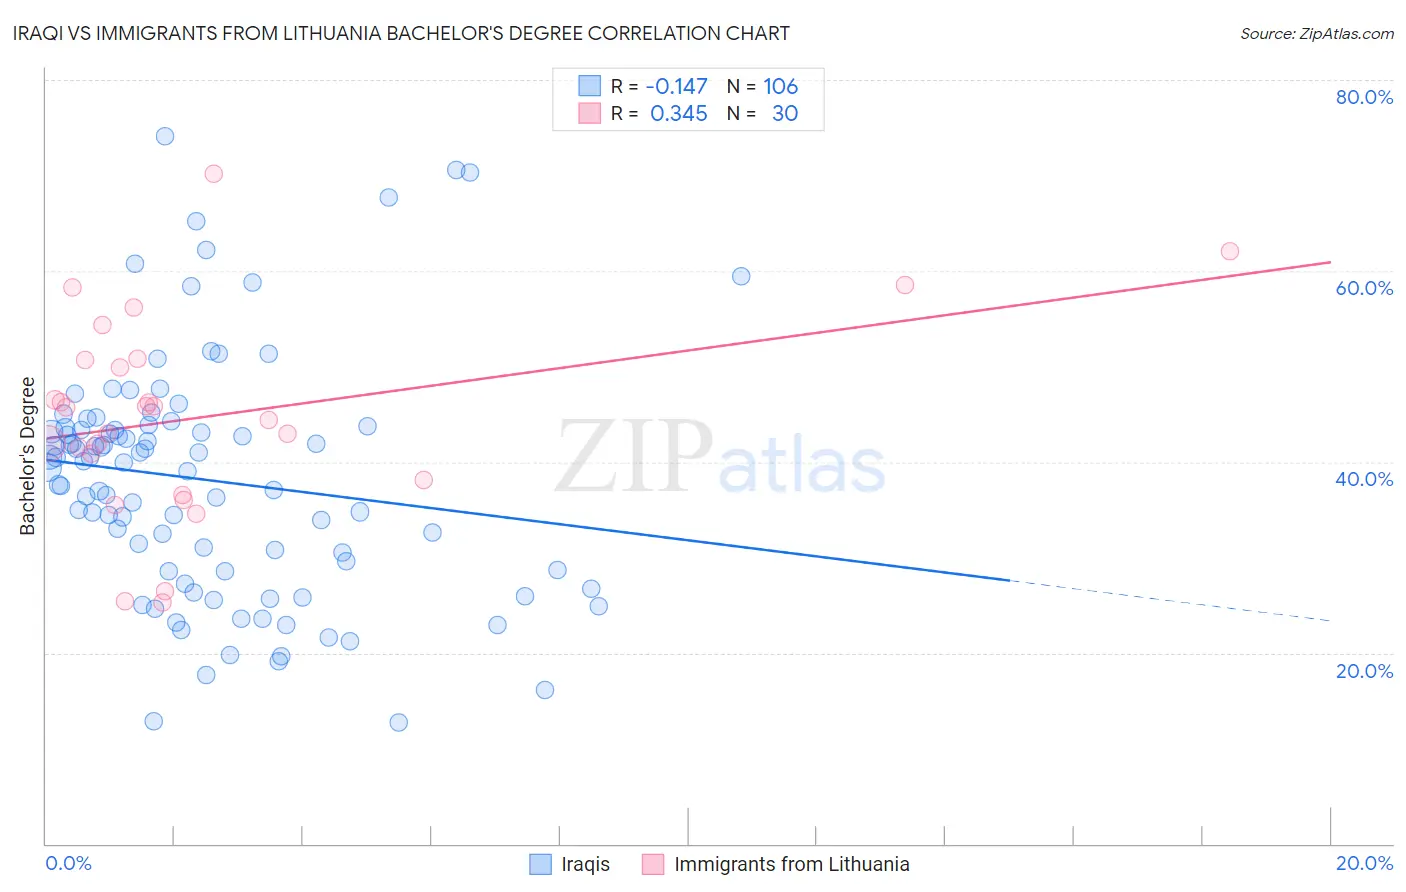
Iraqi vs Immigrants from Lithuania Bachelor's Degree Correlation Chart
The statistical analysis conducted on geographies consisting of 170,654,288 people shows a poor negative correlation between the proportion of Iraqis and percentage of population with at least bachelor's degree education in the United States with a correlation coefficient (R) of -0.147 and weighted average of 39.0%. Similarly, the statistical analysis conducted on geographies consisting of 117,722,731 people shows a mild positive correlation between the proportion of Immigrants from Lithuania and percentage of population with at least bachelor's degree education in the United States with a correlation coefficient (R) of 0.345 and weighted average of 44.6%, a difference of 14.4%.
Bachelor's Degree Correlation Summary
| Measurement | Iraqi | Immigrants from Lithuania |
| Minimum | 12.8% | 25.2% |
| Maximum | 74.1% | 70.2% |
| Range | 61.3% | 45.0% |
| Mean | 38.1% | 44.7% |
| Median | 39.7% | 45.0% |
| Interquartile 25% (IQ1) | 28.6% | 38.1% |
| Interquartile 75% (IQ3) | 43.6% | 50.7% |
| Interquartile Range (IQR) | 15.0% | 12.6% |
| Standard Deviation (Sample) | 12.6% | 10.5% |
| Standard Deviation (Population) | 12.5% | 10.3% |
Similar Demographics by Bachelor's Degree
Demographics Similar to Iraqis by Bachelor's Degree
In terms of bachelor's degree, the demographic groups most similar to Iraqis are Immigrants from Poland (39.0%, a difference of 0.080%), South American (38.9%, a difference of 0.11%), Immigrants from Sierra Leone (39.0%, a difference of 0.14%), Swedish (39.1%, a difference of 0.17%), and Slovene (39.1%, a difference of 0.21%).
| Demographics | Rating | Rank | Bachelor's Degree |
| South American Indians | 83.6 /100 | #141 | Excellent 39.3% |
| Immigrants | North Macedonia | 81.6 /100 | #142 | Excellent 39.2% |
| Poles | 79.8 /100 | #143 | Good 39.1% |
| Immigrants | Afghanistan | 79.7 /100 | #144 | Good 39.1% |
| Slovenes | 79.5 /100 | #145 | Good 39.1% |
| Swedes | 79.2 /100 | #146 | Good 39.1% |
| Immigrants | Sierra Leone | 79.0 /100 | #147 | Good 39.0% |
| Iraqis | 78.1 /100 | #148 | Good 39.0% |
| Immigrants | Poland | 77.5 /100 | #149 | Good 39.0% |
| South Americans | 77.3 /100 | #150 | Good 38.9% |
| Immigrants | Africa | 76.5 /100 | #151 | Good 38.9% |
| Sudanese | 76.4 /100 | #152 | Good 38.9% |
| Slavs | 75.9 /100 | #153 | Good 38.9% |
| Canadians | 75.0 /100 | #154 | Good 38.8% |
| Immigrants | Kenya | 73.8 /100 | #155 | Good 38.8% |
Demographics Similar to Immigrants from Lithuania by Bachelor's Degree
In terms of bachelor's degree, the demographic groups most similar to Immigrants from Lithuania are Immigrants from Kuwait (44.6%, a difference of 0.030%), Immigrants from Bulgaria (44.6%, a difference of 0.080%), Bolivian (44.6%, a difference of 0.12%), Estonian (44.6%, a difference of 0.12%), and Immigrants from Norway (44.5%, a difference of 0.25%).
| Demographics | Rating | Rank | Bachelor's Degree |
| Russians | 100.0 /100 | #37 | Exceptional 45.3% |
| Bulgarians | 100.0 /100 | #38 | Exceptional 45.3% |
| Immigrants | Latvia | 100.0 /100 | #39 | Exceptional 45.1% |
| Immigrants | Belarus | 100.0 /100 | #40 | Exceptional 45.0% |
| Immigrants | Malaysia | 100.0 /100 | #41 | Exceptional 45.0% |
| Immigrants | Saudi Arabia | 100.0 /100 | #42 | Exceptional 44.8% |
| Immigrants | South Africa | 99.9 /100 | #43 | Exceptional 44.8% |
| Immigrants | Lithuania | 99.9 /100 | #44 | Exceptional 44.6% |
| Immigrants | Kuwait | 99.9 /100 | #45 | Exceptional 44.6% |
| Immigrants | Bulgaria | 99.9 /100 | #46 | Exceptional 44.6% |
| Bolivians | 99.9 /100 | #47 | Exceptional 44.6% |
| Estonians | 99.9 /100 | #48 | Exceptional 44.6% |
| Immigrants | Norway | 99.9 /100 | #49 | Exceptional 44.5% |
| Immigrants | Greece | 99.9 /100 | #50 | Exceptional 44.5% |
| Asians | 99.9 /100 | #51 | Exceptional 44.4% |