Inupiat vs Comanche High School Diploma
COMPARE
Inupiat
Comanche
High School Diploma
High School Diploma Comparison
Inupiat
Comanche
88.5%
HIGH SCHOOL DIPLOMA
13.1/ 100
METRIC RATING
211th/ 347
METRIC RANK
87.9%
HIGH SCHOOL DIPLOMA
2.2/ 100
METRIC RATING
240th/ 347
METRIC RANK
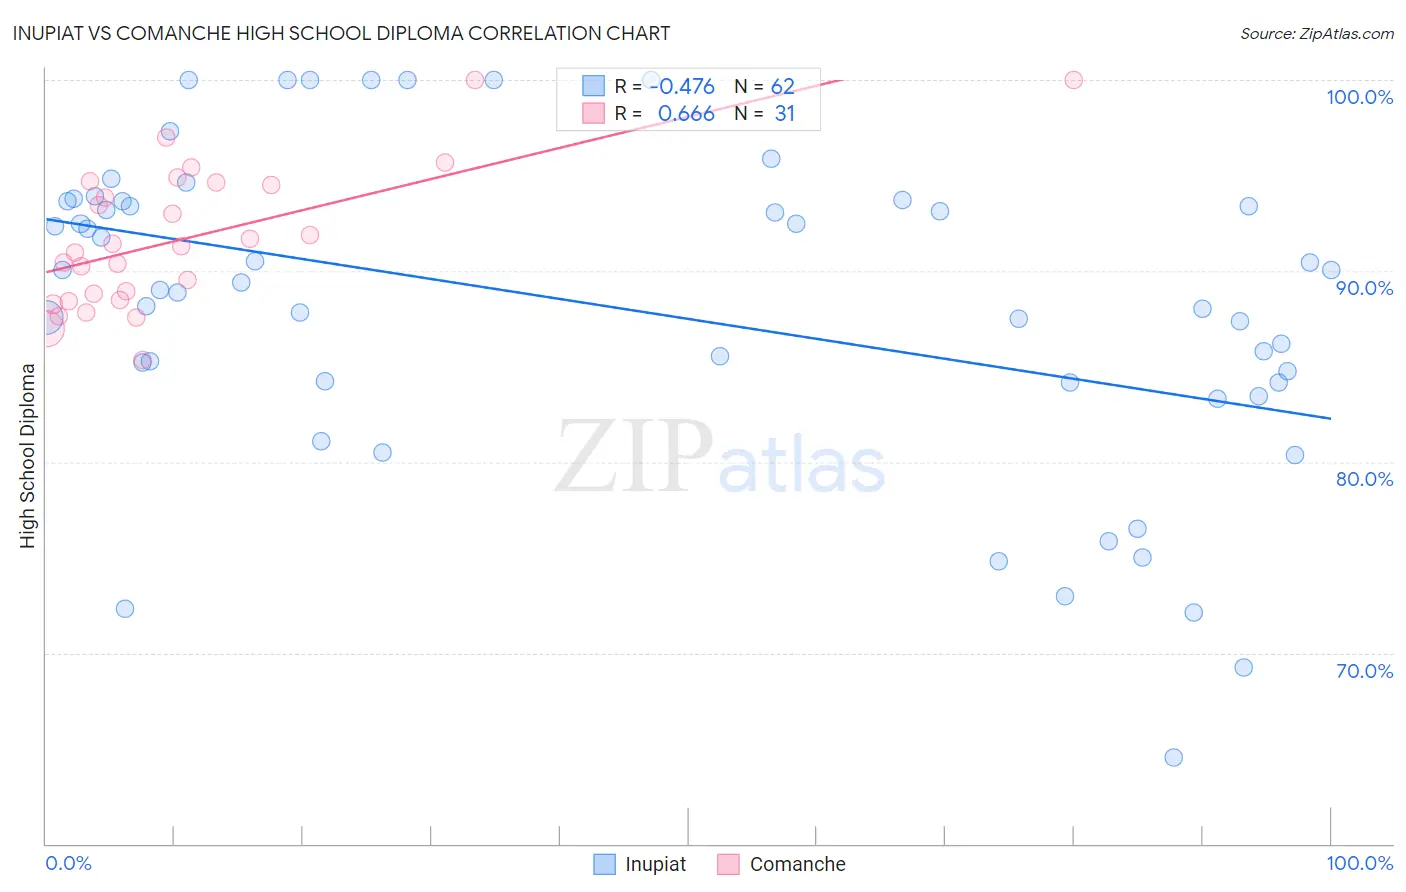
Inupiat vs Comanche High School Diploma Correlation Chart
The statistical analysis conducted on geographies consisting of 96,349,180 people shows a moderate negative correlation between the proportion of Inupiat and percentage of population with at least high school diploma education in the United States with a correlation coefficient (R) of -0.476 and weighted average of 88.5%. Similarly, the statistical analysis conducted on geographies consisting of 109,786,530 people shows a significant positive correlation between the proportion of Comanche and percentage of population with at least high school diploma education in the United States with a correlation coefficient (R) of 0.666 and weighted average of 87.9%, a difference of 0.72%.
High School Diploma Correlation Summary
| Measurement | Inupiat | Comanche |
| Minimum | 64.5% | 85.3% |
| Maximum | 100.0% | 100.0% |
| Range | 35.5% | 14.7% |
| Mean | 88.1% | 91.7% |
| Median | 89.2% | 91.3% |
| Interquartile 25% (IQ1) | 84.2% | 88.5% |
| Interquartile 75% (IQ3) | 93.6% | 94.6% |
| Interquartile Range (IQR) | 9.4% | 6.2% |
| Standard Deviation (Sample) | 8.3% | 3.7% |
| Standard Deviation (Population) | 8.2% | 3.6% |
Similar Demographics by High School Diploma
Demographics Similar to Inupiat by High School Diploma
In terms of high school diploma, the demographic groups most similar to Inupiat are Samoan (88.5%, a difference of 0.030%), South American Indian (88.5%, a difference of 0.030%), Portuguese (88.5%, a difference of 0.040%), Cherokee (88.5%, a difference of 0.040%), and Immigrants from Somalia (88.4%, a difference of 0.070%).
| Demographics | Rating | Rank | High School Diploma |
| Armenians | 17.2 /100 | #204 | Poor 88.6% |
| Immigrants | Micronesia | 16.4 /100 | #205 | Poor 88.6% |
| Arapaho | 16.1 /100 | #206 | Poor 88.6% |
| Immigrants | Sierra Leone | 15.8 /100 | #207 | Poor 88.6% |
| Portuguese | 14.4 /100 | #208 | Poor 88.5% |
| Cherokee | 14.3 /100 | #209 | Poor 88.5% |
| Samoans | 14.0 /100 | #210 | Poor 88.5% |
| Inupiat | 13.1 /100 | #211 | Poor 88.5% |
| South American Indians | 12.2 /100 | #212 | Poor 88.5% |
| Immigrants | Somalia | 11.3 /100 | #213 | Poor 88.4% |
| Immigrants | Cameroon | 10.9 /100 | #214 | Poor 88.4% |
| Crow | 10.9 /100 | #215 | Poor 88.4% |
| Chickasaw | 10.7 /100 | #216 | Poor 88.4% |
| Immigrants | Africa | 10.6 /100 | #217 | Poor 88.4% |
| Immigrants | Bolivia | 10.3 /100 | #218 | Poor 88.4% |
Demographics Similar to Comanche by High School Diploma
In terms of high school diploma, the demographic groups most similar to Comanche are Immigrants from Uzbekistan (87.8%, a difference of 0.030%), Cheyenne (87.8%, a difference of 0.030%), Immigrants from Philippines (87.8%, a difference of 0.050%), Choctaw (87.8%, a difference of 0.060%), and Peruvian (87.8%, a difference of 0.070%).
| Demographics | Rating | Rank | High School Diploma |
| Immigrants | Panama | 3.1 /100 | #233 | Tragic 88.0% |
| Immigrants | Thailand | 3.1 /100 | #234 | Tragic 88.0% |
| Immigrants | Bahamas | 2.9 /100 | #235 | Tragic 88.0% |
| Sub-Saharan Africans | 2.8 /100 | #236 | Tragic 87.9% |
| Taiwanese | 2.8 /100 | #237 | Tragic 87.9% |
| Sioux | 2.7 /100 | #238 | Tragic 87.9% |
| South Americans | 2.7 /100 | #239 | Tragic 87.9% |
| Comanche | 2.2 /100 | #240 | Tragic 87.9% |
| Immigrants | Uzbekistan | 2.1 /100 | #241 | Tragic 87.8% |
| Cheyenne | 2.1 /100 | #242 | Tragic 87.8% |
| Immigrants | Philippines | 1.9 /100 | #243 | Tragic 87.8% |
| Choctaw | 1.9 /100 | #244 | Tragic 87.8% |
| Peruvians | 1.9 /100 | #245 | Tragic 87.8% |
| Immigrants | Eritrea | 1.7 /100 | #246 | Tragic 87.8% |
| Immigrants | Costa Rica | 1.7 /100 | #247 | Tragic 87.8% |