Indian (Asian) vs Immigrants from Moldova Kindergarten
COMPARE
Indian (Asian)
Immigrants from Moldova
Kindergarten
Kindergarten Comparison
Indians (Asian)
Immigrants from Moldova
97.6%
KINDERGARTEN
1.0/ 100
METRIC RATING
246th/ 347
METRIC RANK
98.0%
KINDERGARTEN
69.1/ 100
METRIC RATING
153rd/ 347
METRIC RANK
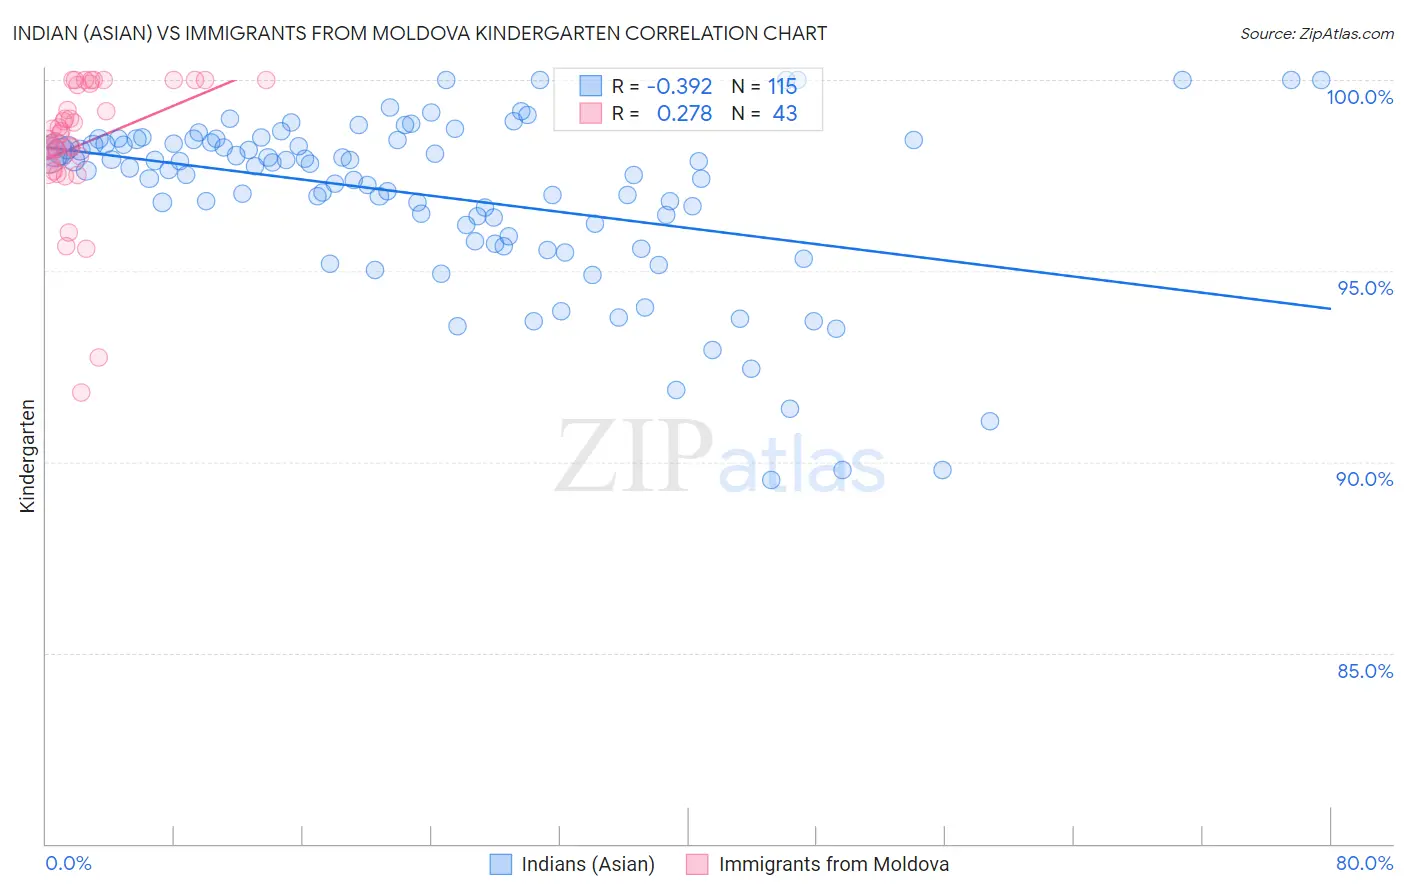
Indian (Asian) vs Immigrants from Moldova Kindergarten Correlation Chart
The statistical analysis conducted on geographies consisting of 495,196,037 people shows a mild negative correlation between the proportion of Indians (Asian) and percentage of population with at least kindergarten education in the United States with a correlation coefficient (R) of -0.392 and weighted average of 97.6%. Similarly, the statistical analysis conducted on geographies consisting of 124,398,501 people shows a weak positive correlation between the proportion of Immigrants from Moldova and percentage of population with at least kindergarten education in the United States with a correlation coefficient (R) of 0.278 and weighted average of 98.0%, a difference of 0.42%.
Kindergarten Correlation Summary
| Measurement | Indian (Asian) | Immigrants from Moldova |
| Minimum | 89.5% | 91.8% |
| Maximum | 100.0% | 100.0% |
| Range | 10.5% | 8.2% |
| Mean | 97.0% | 98.3% |
| Median | 97.7% | 98.6% |
| Interquartile 25% (IQ1) | 95.9% | 97.8% |
| Interquartile 75% (IQ3) | 98.4% | 99.9% |
| Interquartile Range (IQR) | 2.5% | 2.1% |
| Standard Deviation (Sample) | 2.3% | 1.8% |
| Standard Deviation (Population) | 2.2% | 1.8% |
Similar Demographics by Kindergarten
Demographics Similar to Indians (Asian) by Kindergarten
In terms of kindergarten, the demographic groups most similar to Indians (Asian) are South American (97.6%, a difference of 0.0%), Immigrants from Eastern Africa (97.6%, a difference of 0.0%), Immigrants from Middle Africa (97.6%, a difference of 0.0%), Peruvian (97.6%, a difference of 0.0%), and Asian (97.6%, a difference of 0.010%).
| Demographics | Rating | Rank | Kindergarten |
| U.S. Virgin Islanders | 1.7 /100 | #239 | Tragic 97.6% |
| Koreans | 1.6 /100 | #240 | Tragic 97.6% |
| Liberians | 1.3 /100 | #241 | Tragic 97.6% |
| Immigrants | Indonesia | 1.3 /100 | #242 | Tragic 97.6% |
| Asians | 1.2 /100 | #243 | Tragic 97.6% |
| Bolivians | 1.2 /100 | #244 | Tragic 97.6% |
| South Americans | 1.1 /100 | #245 | Tragic 97.6% |
| Indians (Asian) | 1.0 /100 | #246 | Tragic 97.6% |
| Immigrants | Eastern Africa | 1.0 /100 | #247 | Tragic 97.6% |
| Immigrants | Middle Africa | 1.0 /100 | #248 | Tragic 97.6% |
| Peruvians | 1.0 /100 | #249 | Tragic 97.6% |
| Immigrants | Senegal | 0.9 /100 | #250 | Tragic 97.6% |
| Ethiopians | 0.9 /100 | #251 | Tragic 97.6% |
| Immigrants | Iraq | 0.9 /100 | #252 | Tragic 97.6% |
| Immigrants | Africa | 0.8 /100 | #253 | Tragic 97.6% |
Demographics Similar to Immigrants from Moldova by Kindergarten
In terms of kindergarten, the demographic groups most similar to Immigrants from Moldova are Dutch West Indian (98.0%, a difference of 0.0%), Immigrants from Iran (98.0%, a difference of 0.0%), Comanche (98.0%, a difference of 0.0%), Jordanian (98.0%, a difference of 0.010%), and Soviet Union (98.0%, a difference of 0.010%).
| Demographics | Rating | Rank | Kindergarten |
| Filipinos | 78.3 /100 | #146 | Good 98.0% |
| Immigrants | Israel | 77.6 /100 | #147 | Good 98.0% |
| Apache | 75.0 /100 | #148 | Good 98.0% |
| Immigrants | Greece | 74.9 /100 | #149 | Good 98.0% |
| Jordanians | 72.8 /100 | #150 | Good 98.0% |
| Soviet Union | 70.8 /100 | #151 | Good 98.0% |
| Dutch West Indians | 70.1 /100 | #152 | Good 98.0% |
| Immigrants | Moldova | 69.1 /100 | #153 | Good 98.0% |
| Immigrants | Iran | 68.8 /100 | #154 | Good 98.0% |
| Comanche | 68.3 /100 | #155 | Good 98.0% |
| Immigrants | South Central Asia | 66.6 /100 | #156 | Good 98.0% |
| Immigrants | North Macedonia | 66.4 /100 | #157 | Good 98.0% |
| Venezuelans | 64.7 /100 | #158 | Good 98.0% |
| French American Indians | 63.7 /100 | #159 | Good 98.0% |
| Immigrants | Russia | 59.0 /100 | #160 | Average 98.0% |