Indian (Asian) vs Immigrants from Moldova Bachelor's Degree
COMPARE
Indian (Asian)
Immigrants from Moldova
Bachelor's Degree
Bachelor's Degree Comparison
Indians (Asian)
Immigrants from Moldova
47.4%
BACHELOR'S DEGREE
100.0/ 100
METRIC RATING
18th/ 347
METRIC RANK
41.6%
BACHELOR'S DEGREE
98.4/ 100
METRIC RATING
96th/ 347
METRIC RANK
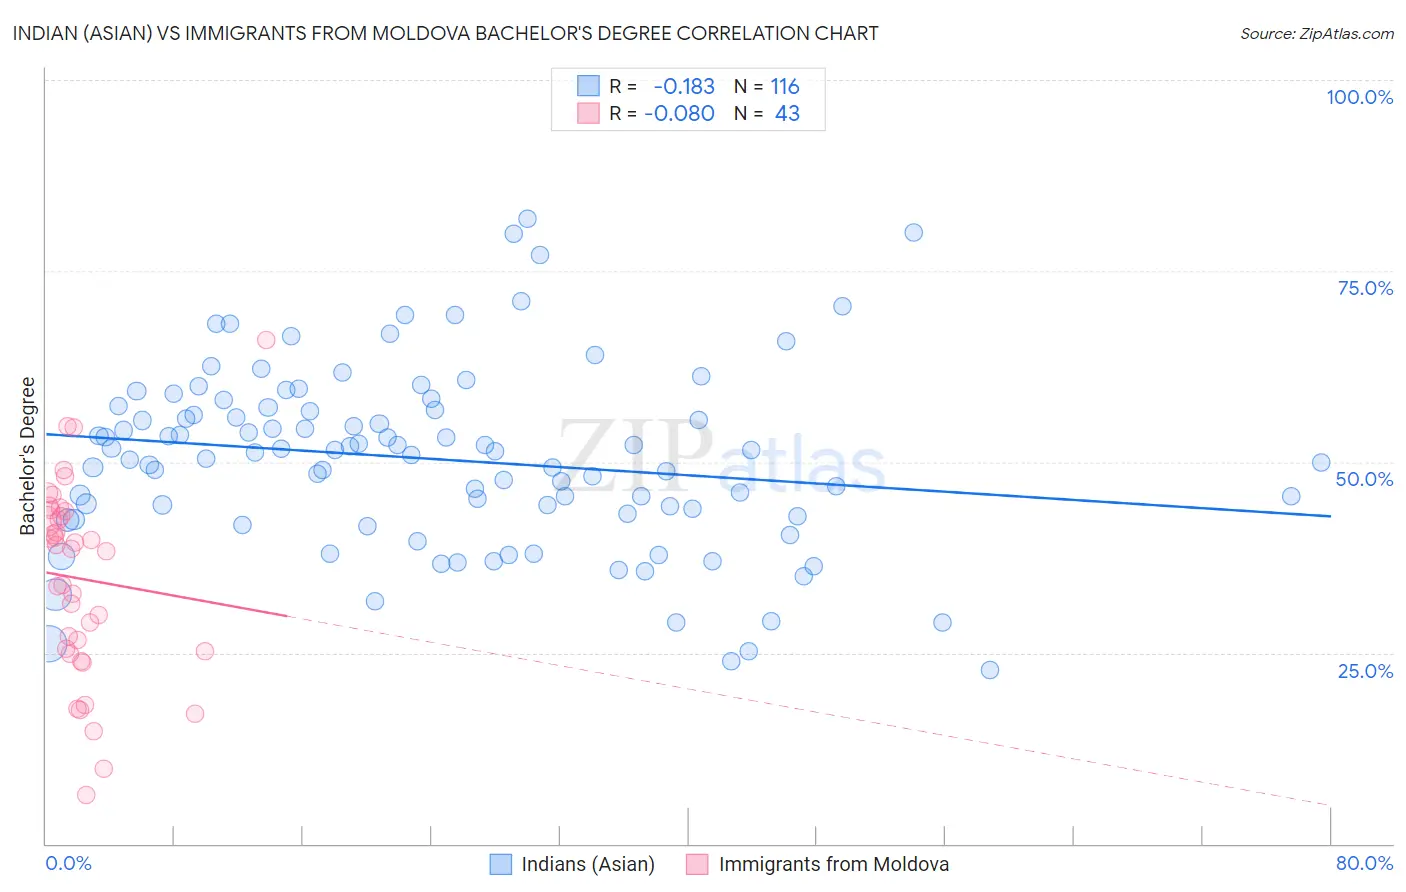
Indian (Asian) vs Immigrants from Moldova Bachelor's Degree Correlation Chart
The statistical analysis conducted on geographies consisting of 495,247,229 people shows a poor negative correlation between the proportion of Indians (Asian) and percentage of population with at least bachelor's degree education in the United States with a correlation coefficient (R) of -0.183 and weighted average of 47.4%. Similarly, the statistical analysis conducted on geographies consisting of 124,396,308 people shows a slight negative correlation between the proportion of Immigrants from Moldova and percentage of population with at least bachelor's degree education in the United States with a correlation coefficient (R) of -0.080 and weighted average of 41.6%, a difference of 14.0%.
Bachelor's Degree Correlation Summary
| Measurement | Indian (Asian) | Immigrants from Moldova |
| Minimum | 22.8% | 6.3% |
| Maximum | 81.8% | 66.0% |
| Range | 59.0% | 59.6% |
| Mean | 50.4% | 34.7% |
| Median | 51.3% | 38.7% |
| Interquartile 25% (IQ1) | 43.1% | 25.2% |
| Interquartile 75% (IQ3) | 56.9% | 43.6% |
| Interquartile Range (IQR) | 13.9% | 18.4% |
| Standard Deviation (Sample) | 11.9% | 12.7% |
| Standard Deviation (Population) | 11.9% | 12.6% |
Similar Demographics by Bachelor's Degree
Demographics Similar to Indians (Asian) by Bachelor's Degree
In terms of bachelor's degree, the demographic groups most similar to Indians (Asian) are Eastern European (47.5%, a difference of 0.15%), Cambodian (47.2%, a difference of 0.43%), Immigrants from Switzerland (47.1%, a difference of 0.65%), Immigrants from Ireland (47.1%, a difference of 0.66%), and Immigrants from Belgium (47.0%, a difference of 0.86%).
| Demographics | Rating | Rank | Bachelor's Degree |
| Immigrants | Australia | 100.0 /100 | #11 | Exceptional 48.5% |
| Immigrants | China | 100.0 /100 | #12 | Exceptional 48.4% |
| Immigrants | South Central Asia | 100.0 /100 | #13 | Exceptional 48.3% |
| Immigrants | Hong Kong | 100.0 /100 | #14 | Exceptional 48.2% |
| Immigrants | Eastern Asia | 100.0 /100 | #15 | Exceptional 48.1% |
| Soviet Union | 100.0 /100 | #16 | Exceptional 47.9% |
| Eastern Europeans | 100.0 /100 | #17 | Exceptional 47.5% |
| Indians (Asian) | 100.0 /100 | #18 | Exceptional 47.4% |
| Cambodians | 100.0 /100 | #19 | Exceptional 47.2% |
| Immigrants | Switzerland | 100.0 /100 | #20 | Exceptional 47.1% |
| Immigrants | Ireland | 100.0 /100 | #21 | Exceptional 47.1% |
| Immigrants | Belgium | 100.0 /100 | #22 | Exceptional 47.0% |
| Immigrants | Sweden | 100.0 /100 | #23 | Exceptional 47.0% |
| Immigrants | Korea | 100.0 /100 | #24 | Exceptional 47.0% |
| Burmese | 100.0 /100 | #25 | Exceptional 46.9% |
Demographics Similar to Immigrants from Moldova by Bachelor's Degree
In terms of bachelor's degree, the demographic groups most similar to Immigrants from Moldova are Romanian (41.6%, a difference of 0.050%), Immigrants from North America (41.7%, a difference of 0.11%), Immigrants from Ukraine (41.5%, a difference of 0.16%), Immigrants from Nepal (41.7%, a difference of 0.23%), and Immigrants from Canada (41.7%, a difference of 0.26%).
| Demographics | Rating | Rank | Bachelor's Degree |
| Greeks | 99.0 /100 | #89 | Exceptional 42.0% |
| Laotians | 98.9 /100 | #90 | Exceptional 42.0% |
| Immigrants | Northern Africa | 98.9 /100 | #91 | Exceptional 41.9% |
| Maltese | 98.8 /100 | #92 | Exceptional 41.9% |
| Immigrants | Canada | 98.6 /100 | #93 | Exceptional 41.7% |
| Immigrants | Nepal | 98.6 /100 | #94 | Exceptional 41.7% |
| Immigrants | North America | 98.5 /100 | #95 | Exceptional 41.7% |
| Immigrants | Moldova | 98.4 /100 | #96 | Exceptional 41.6% |
| Romanians | 98.4 /100 | #97 | Exceptional 41.6% |
| Immigrants | Ukraine | 98.3 /100 | #98 | Exceptional 41.5% |
| Immigrants | England | 98.1 /100 | #99 | Exceptional 41.4% |
| Macedonians | 98.1 /100 | #100 | Exceptional 41.4% |
| Immigrants | Morocco | 98.0 /100 | #101 | Exceptional 41.4% |
| Immigrants | Italy | 97.8 /100 | #102 | Exceptional 41.3% |
| Chileans | 97.5 /100 | #103 | Exceptional 41.2% |