Indian (Asian) vs Immigrants from Moldova College, 1 year or more
COMPARE
Indian (Asian)
Immigrants from Moldova
College, 1 year or more
College, 1 year or more Comparison
Indians (Asian)
Immigrants from Moldova
66.1%
COLLEGE, 1 YEAR OR MORE
100.0/ 100
METRIC RATING
25th/ 347
METRIC RANK
63.0%
COLLEGE, 1 YEAR OR MORE
99.0/ 100
METRIC RATING
73rd/ 347
METRIC RANK
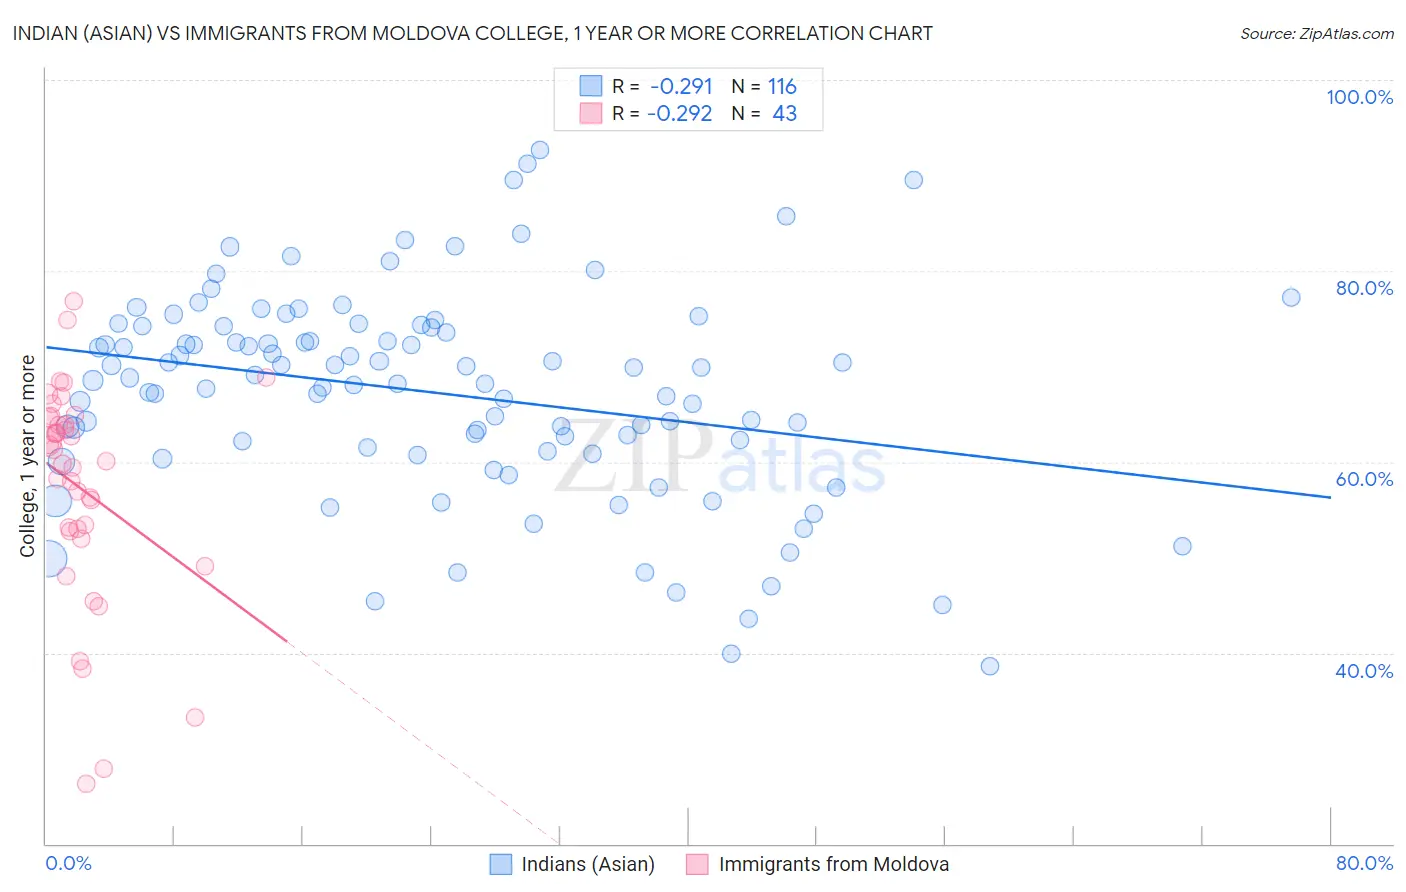
Indian (Asian) vs Immigrants from Moldova College, 1 year or more Correlation Chart
The statistical analysis conducted on geographies consisting of 495,342,032 people shows a weak negative correlation between the proportion of Indians (Asian) and percentage of population with at least college, 1 year or more education in the United States with a correlation coefficient (R) of -0.291 and weighted average of 66.1%. Similarly, the statistical analysis conducted on geographies consisting of 124,398,509 people shows a weak negative correlation between the proportion of Immigrants from Moldova and percentage of population with at least college, 1 year or more education in the United States with a correlation coefficient (R) of -0.292 and weighted average of 63.0%, a difference of 4.8%.
College, 1 year or more Correlation Summary
| Measurement | Indian (Asian) | Immigrants from Moldova |
| Minimum | 38.6% | 26.3% |
| Maximum | 92.7% | 76.8% |
| Range | 54.1% | 50.4% |
| Mean | 67.3% | 57.2% |
| Median | 68.7% | 60.0% |
| Interquartile 25% (IQ1) | 61.3% | 52.7% |
| Interquartile 75% (IQ3) | 74.1% | 64.6% |
| Interquartile Range (IQR) | 12.8% | 12.0% |
| Standard Deviation (Sample) | 10.8% | 11.4% |
| Standard Deviation (Population) | 10.8% | 11.3% |
Similar Demographics by College, 1 year or more
Demographics Similar to Indians (Asian) by College, 1 year or more
In terms of college, 1 year or more, the demographic groups most similar to Indians (Asian) are Latvian (66.1%, a difference of 0.040%), Immigrants from Ireland (65.9%, a difference of 0.24%), Immigrants from Belgium (66.3%, a difference of 0.35%), Immigrants from France (65.8%, a difference of 0.41%), and Immigrants from China (66.4%, a difference of 0.43%).
| Demographics | Rating | Rank | College, 1 year or more |
| Eastern Europeans | 100.0 /100 | #18 | Exceptional 66.6% |
| Immigrants | Switzerland | 100.0 /100 | #19 | Exceptional 66.5% |
| Immigrants | Korea | 100.0 /100 | #20 | Exceptional 66.5% |
| Immigrants | Hong Kong | 100.0 /100 | #21 | Exceptional 66.4% |
| Soviet Union | 100.0 /100 | #22 | Exceptional 66.4% |
| Immigrants | China | 100.0 /100 | #23 | Exceptional 66.4% |
| Immigrants | Belgium | 100.0 /100 | #24 | Exceptional 66.3% |
| Indians (Asian) | 100.0 /100 | #25 | Exceptional 66.1% |
| Latvians | 100.0 /100 | #26 | Exceptional 66.1% |
| Immigrants | Ireland | 100.0 /100 | #27 | Exceptional 65.9% |
| Immigrants | France | 100.0 /100 | #28 | Exceptional 65.8% |
| Immigrants | Northern Europe | 100.0 /100 | #29 | Exceptional 65.6% |
| Immigrants | Denmark | 100.0 /100 | #30 | Exceptional 65.6% |
| Turks | 100.0 /100 | #31 | Exceptional 65.5% |
| Bulgarians | 100.0 /100 | #32 | Exceptional 65.5% |
Demographics Similar to Immigrants from Moldova by College, 1 year or more
In terms of college, 1 year or more, the demographic groups most similar to Immigrants from Moldova are Egyptian (63.1%, a difference of 0.010%), Immigrants from North America (63.0%, a difference of 0.020%), Immigrants from Canada (63.1%, a difference of 0.070%), Armenian (63.0%, a difference of 0.11%), and Paraguayan (62.9%, a difference of 0.21%).
| Demographics | Rating | Rank | College, 1 year or more |
| Immigrants | Europe | 99.3 /100 | #66 | Exceptional 63.3% |
| Immigrants | Romania | 99.3 /100 | #67 | Exceptional 63.3% |
| Immigrants | Greece | 99.3 /100 | #68 | Exceptional 63.3% |
| Immigrants | Zimbabwe | 99.3 /100 | #69 | Exceptional 63.3% |
| Argentineans | 99.2 /100 | #70 | Exceptional 63.2% |
| Immigrants | Canada | 99.1 /100 | #71 | Exceptional 63.1% |
| Egyptians | 99.0 /100 | #72 | Exceptional 63.1% |
| Immigrants | Moldova | 99.0 /100 | #73 | Exceptional 63.0% |
| Immigrants | North America | 99.0 /100 | #74 | Exceptional 63.0% |
| Armenians | 98.9 /100 | #75 | Exceptional 63.0% |
| Paraguayans | 98.8 /100 | #76 | Exceptional 62.9% |
| Ethiopians | 98.8 /100 | #77 | Exceptional 62.9% |
| Immigrants | Lebanon | 98.8 /100 | #78 | Exceptional 62.9% |
| Northern Europeans | 98.8 /100 | #79 | Exceptional 62.9% |
| Lithuanians | 98.8 /100 | #80 | Exceptional 62.9% |