Immigrants vs U.S. Virgin Islander 10th Grade
COMPARE
Immigrants
U.S. Virgin Islander
10th Grade
10th Grade Comparison
Immigrants
U.S. Virgin Islanders
91.0%
10TH GRADE
0.0/ 100
METRIC RATING
309th/ 347
METRIC RANK
92.7%
10TH GRADE
0.7/ 100
METRIC RATING
257th/ 347
METRIC RANK
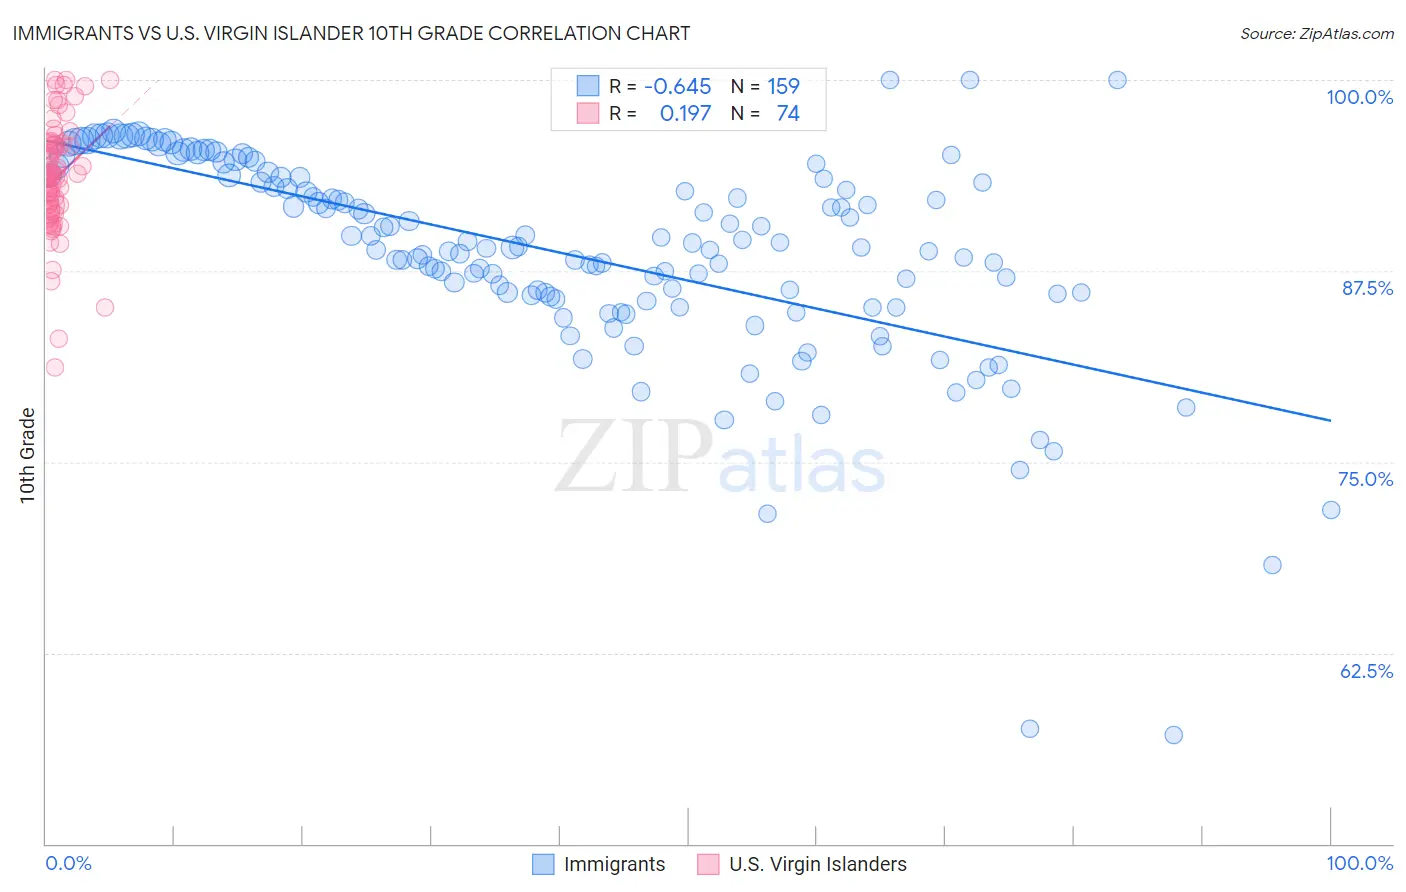
Immigrants vs U.S. Virgin Islander 10th Grade Correlation Chart
The statistical analysis conducted on geographies consisting of 577,786,366 people shows a significant negative correlation between the proportion of Immigrants and percentage of population with at least 10th grade education in the United States with a correlation coefficient (R) of -0.645 and weighted average of 91.0%. Similarly, the statistical analysis conducted on geographies consisting of 87,529,315 people shows a poor positive correlation between the proportion of U.S. Virgin Islanders and percentage of population with at least 10th grade education in the United States with a correlation coefficient (R) of 0.197 and weighted average of 92.7%, a difference of 1.9%.
10th Grade Correlation Summary
| Measurement | Immigrants | U.S. Virgin Islander |
| Minimum | 57.2% | 81.1% |
| Maximum | 100.0% | 100.0% |
| Range | 42.8% | 18.9% |
| Mean | 88.6% | 93.6% |
| Median | 89.1% | 93.8% |
| Interquartile 25% (IQ1) | 85.8% | 91.6% |
| Interquartile 75% (IQ3) | 93.6% | 95.8% |
| Interquartile Range (IQR) | 7.8% | 4.3% |
| Standard Deviation (Sample) | 6.9% | 3.7% |
| Standard Deviation (Population) | 6.8% | 3.7% |
Similar Demographics by 10th Grade
Demographics Similar to Immigrants by 10th Grade
In terms of 10th grade, the demographic groups most similar to Immigrants are Immigrants from Bangladesh (91.0%, a difference of 0.040%), Vietnamese (90.9%, a difference of 0.040%), Immigrants from Fiji (91.0%, a difference of 0.050%), Immigrants from Cambodia (90.9%, a difference of 0.060%), and Yaqui (91.1%, a difference of 0.11%).
| Demographics | Rating | Rank | 10th Grade |
| Immigrants | Guyana | 0.0 /100 | #302 | Tragic 91.2% |
| Immigrants | Vietnam | 0.0 /100 | #303 | Tragic 91.2% |
| Pima | 0.0 /100 | #304 | Tragic 91.2% |
| Immigrants | Dominica | 0.0 /100 | #305 | Tragic 91.1% |
| Yaqui | 0.0 /100 | #306 | Tragic 91.1% |
| Immigrants | Fiji | 0.0 /100 | #307 | Tragic 91.0% |
| Immigrants | Bangladesh | 0.0 /100 | #308 | Tragic 91.0% |
| Immigrants | Immigrants | 0.0 /100 | #309 | Tragic 91.0% |
| Vietnamese | 0.0 /100 | #310 | Tragic 90.9% |
| Immigrants | Cambodia | 0.0 /100 | #311 | Tragic 90.9% |
| Immigrants | Portugal | 0.0 /100 | #312 | Tragic 90.8% |
| Cape Verdeans | 0.0 /100 | #313 | Tragic 90.8% |
| Nepalese | 0.0 /100 | #314 | Tragic 90.7% |
| Immigrants | Caribbean | 0.0 /100 | #315 | Tragic 90.6% |
| Ecuadorians | 0.0 /100 | #316 | Tragic 90.6% |
Demographics Similar to U.S. Virgin Islanders by 10th Grade
In terms of 10th grade, the demographic groups most similar to U.S. Virgin Islanders are Immigrants from Nigeria (92.7%, a difference of 0.010%), Immigrants from Costa Rica (92.7%, a difference of 0.010%), Immigrants from Bolivia (92.7%, a difference of 0.020%), Immigrants from Jamaica (92.6%, a difference of 0.040%), and Immigrants from Uzbekistan (92.6%, a difference of 0.060%).
| Demographics | Rating | Rank | 10th Grade |
| Jamaicans | 1.2 /100 | #250 | Tragic 92.8% |
| Immigrants | Thailand | 1.0 /100 | #251 | Tragic 92.8% |
| South Americans | 0.9 /100 | #252 | Tragic 92.8% |
| Ghanaians | 0.9 /100 | #253 | Tragic 92.8% |
| Armenians | 0.9 /100 | #254 | Tragic 92.7% |
| Immigrants | Bolivia | 0.7 /100 | #255 | Tragic 92.7% |
| Immigrants | Nigeria | 0.7 /100 | #256 | Tragic 92.7% |
| U.S. Virgin Islanders | 0.7 /100 | #257 | Tragic 92.7% |
| Immigrants | Costa Rica | 0.6 /100 | #258 | Tragic 92.7% |
| Immigrants | Jamaica | 0.5 /100 | #259 | Tragic 92.6% |
| Immigrants | Uzbekistan | 0.5 /100 | #260 | Tragic 92.6% |
| Paiute | 0.4 /100 | #261 | Tragic 92.6% |
| Immigrants | South America | 0.4 /100 | #262 | Tragic 92.6% |
| Apache | 0.4 /100 | #263 | Tragic 92.6% |
| Peruvians | 0.4 /100 | #264 | Tragic 92.6% |