Immigrants vs Immigrants from Western Asia 10th Grade
COMPARE
Immigrants
Immigrants from Western Asia
10th Grade
10th Grade Comparison
Immigrants
Immigrants from Western Asia
91.0%
10TH GRADE
0.0/ 100
METRIC RATING
309th/ 347
METRIC RANK
93.4%
10TH GRADE
20.6/ 100
METRIC RATING
203rd/ 347
METRIC RANK
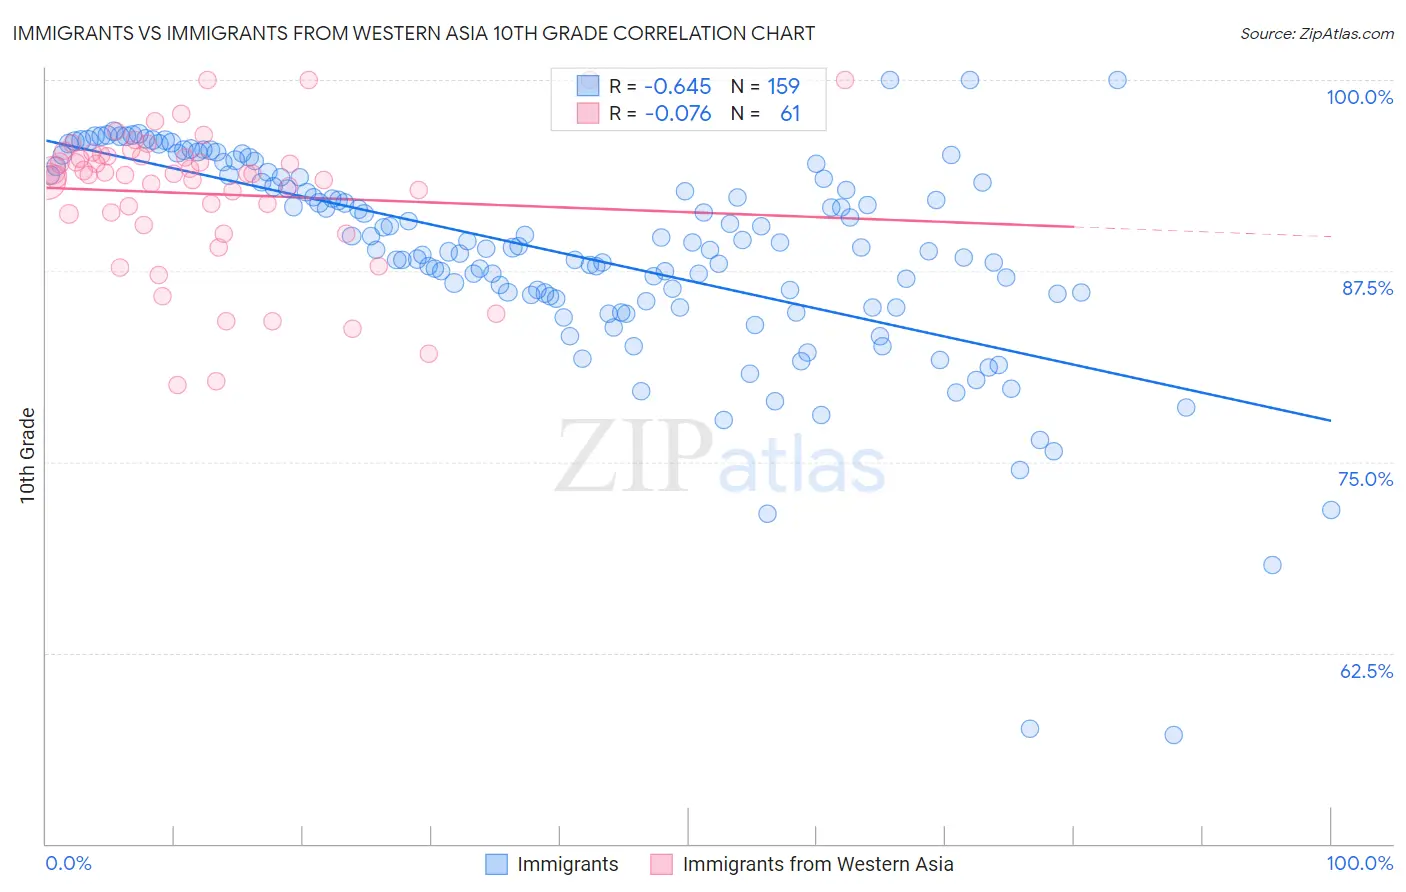
Immigrants vs Immigrants from Western Asia 10th Grade Correlation Chart
The statistical analysis conducted on geographies consisting of 577,786,366 people shows a significant negative correlation between the proportion of Immigrants and percentage of population with at least 10th grade education in the United States with a correlation coefficient (R) of -0.645 and weighted average of 91.0%. Similarly, the statistical analysis conducted on geographies consisting of 404,433,811 people shows a slight negative correlation between the proportion of Immigrants from Western Asia and percentage of population with at least 10th grade education in the United States with a correlation coefficient (R) of -0.076 and weighted average of 93.4%, a difference of 2.7%.
10th Grade Correlation Summary
| Measurement | Immigrants | Immigrants from Western Asia |
| Minimum | 57.2% | 80.0% |
| Maximum | 100.0% | 100.0% |
| Range | 42.8% | 20.0% |
| Mean | 88.6% | 92.6% |
| Median | 89.1% | 93.8% |
| Interquartile 25% (IQ1) | 85.8% | 90.9% |
| Interquartile 75% (IQ3) | 93.6% | 95.1% |
| Interquartile Range (IQR) | 7.8% | 4.2% |
| Standard Deviation (Sample) | 6.9% | 4.6% |
| Standard Deviation (Population) | 6.8% | 4.6% |
Similar Demographics by 10th Grade
Demographics Similar to Immigrants by 10th Grade
In terms of 10th grade, the demographic groups most similar to Immigrants are Immigrants from Bangladesh (91.0%, a difference of 0.040%), Vietnamese (90.9%, a difference of 0.040%), Immigrants from Fiji (91.0%, a difference of 0.050%), Immigrants from Cambodia (90.9%, a difference of 0.060%), and Yaqui (91.1%, a difference of 0.11%).
| Demographics | Rating | Rank | 10th Grade |
| Immigrants | Guyana | 0.0 /100 | #302 | Tragic 91.2% |
| Immigrants | Vietnam | 0.0 /100 | #303 | Tragic 91.2% |
| Pima | 0.0 /100 | #304 | Tragic 91.2% |
| Immigrants | Dominica | 0.0 /100 | #305 | Tragic 91.1% |
| Yaqui | 0.0 /100 | #306 | Tragic 91.1% |
| Immigrants | Fiji | 0.0 /100 | #307 | Tragic 91.0% |
| Immigrants | Bangladesh | 0.0 /100 | #308 | Tragic 91.0% |
| Immigrants | Immigrants | 0.0 /100 | #309 | Tragic 91.0% |
| Vietnamese | 0.0 /100 | #310 | Tragic 90.9% |
| Immigrants | Cambodia | 0.0 /100 | #311 | Tragic 90.9% |
| Immigrants | Portugal | 0.0 /100 | #312 | Tragic 90.8% |
| Cape Verdeans | 0.0 /100 | #313 | Tragic 90.8% |
| Nepalese | 0.0 /100 | #314 | Tragic 90.7% |
| Immigrants | Caribbean | 0.0 /100 | #315 | Tragic 90.6% |
| Ecuadorians | 0.0 /100 | #316 | Tragic 90.6% |
Demographics Similar to Immigrants from Western Asia by 10th Grade
In terms of 10th grade, the demographic groups most similar to Immigrants from Western Asia are Ute (93.4%, a difference of 0.0%), Immigrants from Indonesia (93.4%, a difference of 0.0%), Immigrants from Uganda (93.5%, a difference of 0.010%), Immigrants from Sudan (93.4%, a difference of 0.010%), and Samoan (93.4%, a difference of 0.010%).
| Demographics | Rating | Rank | 10th Grade |
| Moroccans | 25.3 /100 | #196 | Fair 93.5% |
| Pueblo | 23.9 /100 | #197 | Fair 93.5% |
| Immigrants | Micronesia | 23.2 /100 | #198 | Fair 93.5% |
| Asians | 23.0 /100 | #199 | Fair 93.5% |
| Hopi | 22.2 /100 | #200 | Fair 93.5% |
| Hawaiians | 21.8 /100 | #201 | Fair 93.5% |
| Immigrants | Uganda | 20.9 /100 | #202 | Fair 93.5% |
| Immigrants | Western Asia | 20.6 /100 | #203 | Fair 93.4% |
| Ute | 20.3 /100 | #204 | Fair 93.4% |
| Immigrants | Indonesia | 20.2 /100 | #205 | Fair 93.4% |
| Immigrants | Sudan | 20.0 /100 | #206 | Fair 93.4% |
| Samoans | 19.5 /100 | #207 | Poor 93.4% |
| Immigrants | Syria | 19.4 /100 | #208 | Poor 93.4% |
| Immigrants | Chile | 18.8 /100 | #209 | Poor 93.4% |
| Indians (Asian) | 17.6 /100 | #210 | Poor 93.4% |