Immigrants from Dominican Republic vs U.S. Virgin Islander 10th Grade
COMPARE
Immigrants from Dominican Republic
U.S. Virgin Islander
10th Grade
10th Grade Comparison
Immigrants from Dominican Republic
U.S. Virgin Islanders
88.7%
10TH GRADE
0.0/ 100
METRIC RATING
335th/ 347
METRIC RANK
92.7%
10TH GRADE
0.7/ 100
METRIC RATING
257th/ 347
METRIC RANK
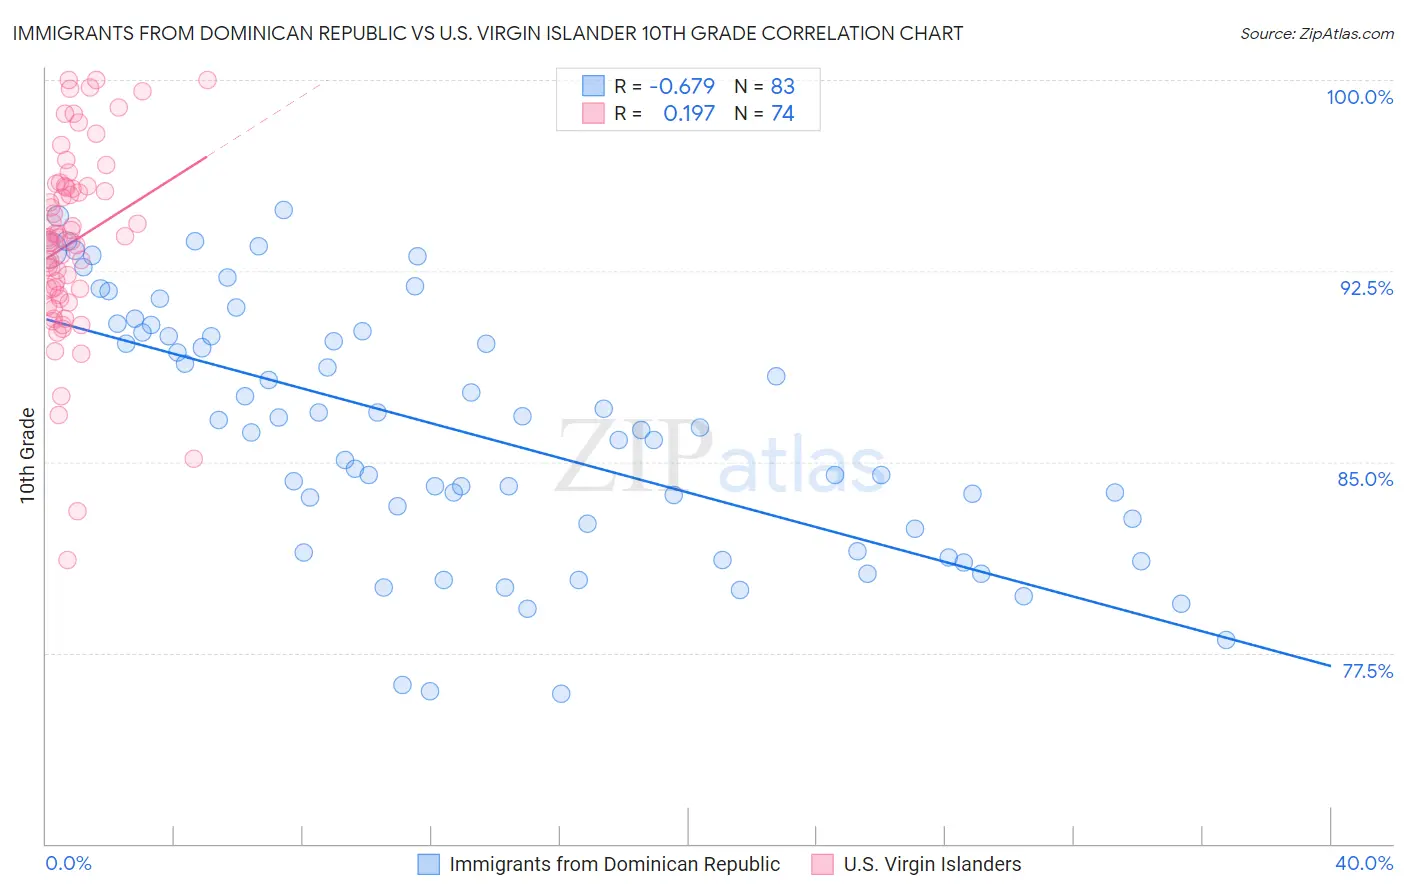
Immigrants from Dominican Republic vs U.S. Virgin Islander 10th Grade Correlation Chart
The statistical analysis conducted on geographies consisting of 275,144,349 people shows a significant negative correlation between the proportion of Immigrants from Dominican Republic and percentage of population with at least 10th grade education in the United States with a correlation coefficient (R) of -0.679 and weighted average of 88.7%. Similarly, the statistical analysis conducted on geographies consisting of 87,529,315 people shows a poor positive correlation between the proportion of U.S. Virgin Islanders and percentage of population with at least 10th grade education in the United States with a correlation coefficient (R) of 0.197 and weighted average of 92.7%, a difference of 4.5%.
10th Grade Correlation Summary
| Measurement | Immigrants from Dominican Republic | U.S. Virgin Islander |
| Minimum | 75.9% | 81.1% |
| Maximum | 94.9% | 100.0% |
| Range | 19.0% | 18.9% |
| Mean | 86.1% | 93.6% |
| Median | 86.3% | 93.8% |
| Interquartile 25% (IQ1) | 82.4% | 91.6% |
| Interquartile 75% (IQ3) | 90.1% | 95.8% |
| Interquartile Range (IQR) | 7.7% | 4.3% |
| Standard Deviation (Sample) | 4.9% | 3.7% |
| Standard Deviation (Population) | 4.8% | 3.7% |
Similar Demographics by 10th Grade
Demographics Similar to Immigrants from Dominican Republic by 10th Grade
In terms of 10th grade, the demographic groups most similar to Immigrants from Dominican Republic are Hispanic or Latino (88.9%, a difference of 0.18%), Immigrants from Honduras (88.5%, a difference of 0.19%), Honduran (89.0%, a difference of 0.30%), Immigrants from the Azores (89.0%, a difference of 0.33%), and Central American (88.4%, a difference of 0.35%).
| Demographics | Rating | Rank | 10th Grade |
| Immigrants | Cabo Verde | 0.0 /100 | #328 | Tragic 89.5% |
| Dominicans | 0.0 /100 | #329 | Tragic 89.4% |
| Immigrants | Yemen | 0.0 /100 | #330 | Tragic 89.1% |
| Mexican American Indians | 0.0 /100 | #331 | Tragic 89.0% |
| Immigrants | Azores | 0.0 /100 | #332 | Tragic 89.0% |
| Hondurans | 0.0 /100 | #333 | Tragic 89.0% |
| Hispanics or Latinos | 0.0 /100 | #334 | Tragic 88.9% |
| Immigrants | Dominican Republic | 0.0 /100 | #335 | Tragic 88.7% |
| Immigrants | Honduras | 0.0 /100 | #336 | Tragic 88.5% |
| Central Americans | 0.0 /100 | #337 | Tragic 88.4% |
| Immigrants | Latin America | 0.0 /100 | #338 | Tragic 88.3% |
| Guatemalans | 0.0 /100 | #339 | Tragic 87.9% |
| Mexicans | 0.0 /100 | #340 | Tragic 87.8% |
| Salvadorans | 0.0 /100 | #341 | Tragic 87.5% |
| Immigrants | Guatemala | 0.0 /100 | #342 | Tragic 87.4% |
Demographics Similar to U.S. Virgin Islanders by 10th Grade
In terms of 10th grade, the demographic groups most similar to U.S. Virgin Islanders are Immigrants from Nigeria (92.7%, a difference of 0.010%), Immigrants from Costa Rica (92.7%, a difference of 0.010%), Immigrants from Bolivia (92.7%, a difference of 0.020%), Immigrants from Jamaica (92.6%, a difference of 0.040%), and Immigrants from Uzbekistan (92.6%, a difference of 0.060%).
| Demographics | Rating | Rank | 10th Grade |
| Jamaicans | 1.2 /100 | #250 | Tragic 92.8% |
| Immigrants | Thailand | 1.0 /100 | #251 | Tragic 92.8% |
| South Americans | 0.9 /100 | #252 | Tragic 92.8% |
| Ghanaians | 0.9 /100 | #253 | Tragic 92.8% |
| Armenians | 0.9 /100 | #254 | Tragic 92.7% |
| Immigrants | Bolivia | 0.7 /100 | #255 | Tragic 92.7% |
| Immigrants | Nigeria | 0.7 /100 | #256 | Tragic 92.7% |
| U.S. Virgin Islanders | 0.7 /100 | #257 | Tragic 92.7% |
| Immigrants | Costa Rica | 0.6 /100 | #258 | Tragic 92.7% |
| Immigrants | Jamaica | 0.5 /100 | #259 | Tragic 92.6% |
| Immigrants | Uzbekistan | 0.5 /100 | #260 | Tragic 92.6% |
| Paiute | 0.4 /100 | #261 | Tragic 92.6% |
| Immigrants | South America | 0.4 /100 | #262 | Tragic 92.6% |
| Apache | 0.4 /100 | #263 | Tragic 92.6% |
| Peruvians | 0.4 /100 | #264 | Tragic 92.6% |