Immigrants vs Paiute 11th Grade
COMPARE
Immigrants
Paiute
11th Grade
11th Grade Comparison
Immigrants
Paiute
89.7%
11TH GRADE
0.0/ 100
METRIC RATING
303rd/ 347
METRIC RANK
91.0%
11TH GRADE
0.1/ 100
METRIC RATING
273rd/ 347
METRIC RANK
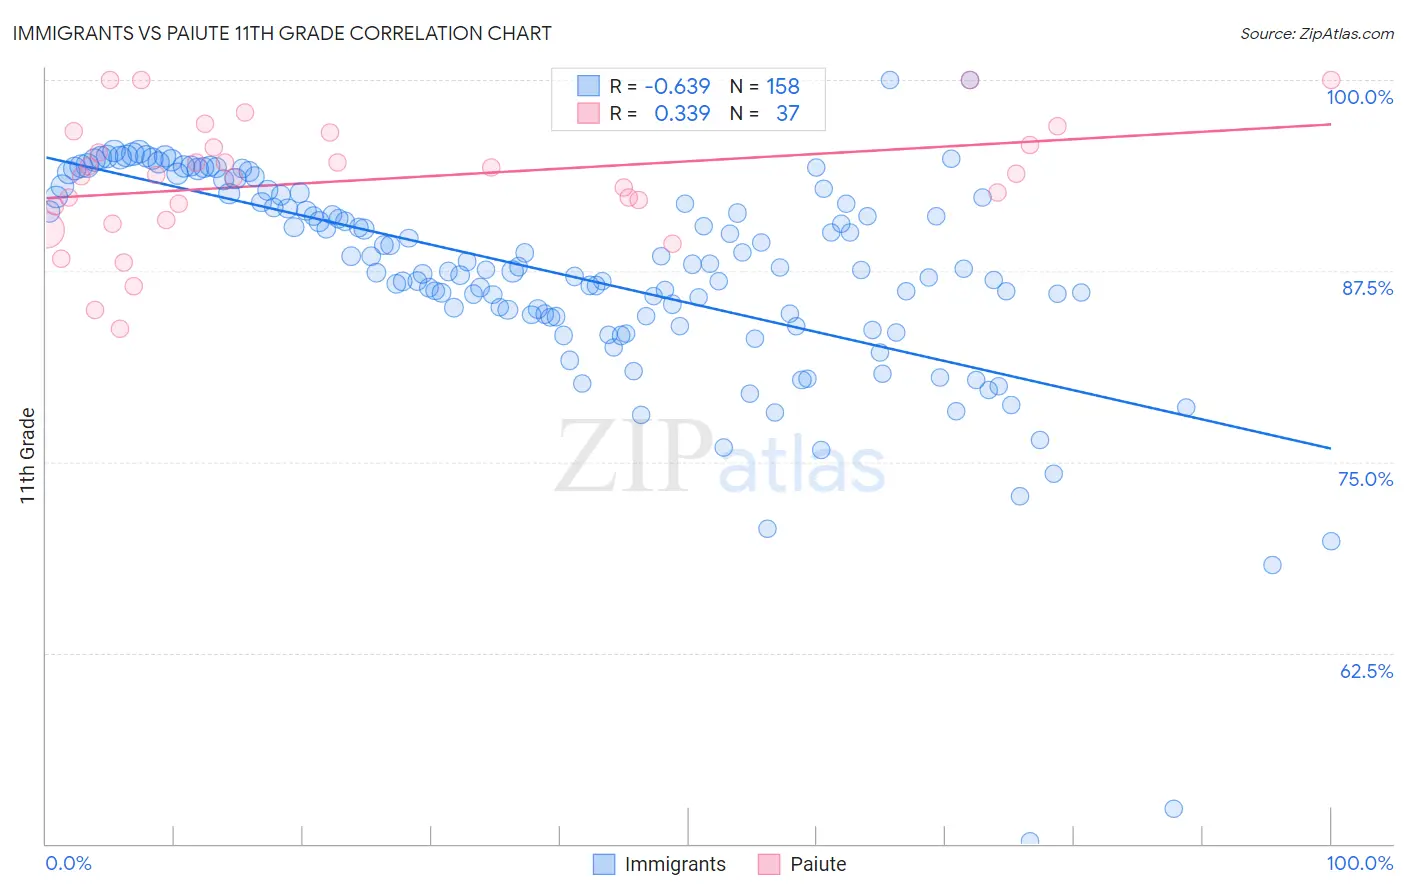
Immigrants vs Paiute 11th Grade Correlation Chart
The statistical analysis conducted on geographies consisting of 577,785,939 people shows a significant negative correlation between the proportion of Immigrants and percentage of population with at least 11th grade education in the United States with a correlation coefficient (R) of -0.639 and weighted average of 89.7%. Similarly, the statistical analysis conducted on geographies consisting of 58,403,520 people shows a mild positive correlation between the proportion of Paiute and percentage of population with at least 11th grade education in the United States with a correlation coefficient (R) of 0.339 and weighted average of 91.0%, a difference of 1.4%.
11th Grade Correlation Summary
| Measurement | Immigrants | Paiute |
| Minimum | 50.2% | 83.7% |
| Maximum | 100.0% | 100.0% |
| Range | 49.8% | 16.3% |
| Mean | 87.3% | 93.4% |
| Median | 87.7% | 93.8% |
| Interquartile 25% (IQ1) | 84.6% | 91.3% |
| Interquartile 75% (IQ3) | 92.3% | 96.2% |
| Interquartile Range (IQR) | 7.8% | 4.9% |
| Standard Deviation (Sample) | 7.1% | 4.0% |
| Standard Deviation (Population) | 7.1% | 4.0% |
Similar Demographics by 11th Grade
Demographics Similar to Immigrants by 11th Grade
In terms of 11th grade, the demographic groups most similar to Immigrants are Yuman (89.7%, a difference of 0.0%), Immigrants from Guyana (89.7%, a difference of 0.010%), Immigrants from Cambodia (89.6%, a difference of 0.080%), Ecuadorian (89.6%, a difference of 0.13%), and Immigrants from Dominica (89.5%, a difference of 0.19%).
| Demographics | Rating | Rank | 11th Grade |
| Fijians | 0.0 /100 | #296 | Tragic 90.0% |
| Navajo | 0.0 /100 | #297 | Tragic 90.0% |
| Immigrants | Fiji | 0.0 /100 | #298 | Tragic 89.9% |
| Japanese | 0.0 /100 | #299 | Tragic 89.9% |
| Immigrants | Haiti | 0.0 /100 | #300 | Tragic 89.9% |
| Guyanese | 0.0 /100 | #301 | Tragic 89.9% |
| Immigrants | Guyana | 0.0 /100 | #302 | Tragic 89.7% |
| Immigrants | Immigrants | 0.0 /100 | #303 | Tragic 89.7% |
| Yuman | 0.0 /100 | #304 | Tragic 89.7% |
| Immigrants | Cambodia | 0.0 /100 | #305 | Tragic 89.6% |
| Ecuadorians | 0.0 /100 | #306 | Tragic 89.6% |
| Immigrants | Dominica | 0.0 /100 | #307 | Tragic 89.5% |
| Nepalese | 0.0 /100 | #308 | Tragic 89.5% |
| Immigrants | Bangladesh | 0.0 /100 | #309 | Tragic 89.5% |
| Yaqui | 0.0 /100 | #310 | Tragic 89.5% |
Demographics Similar to Paiute by 11th Grade
In terms of 11th grade, the demographic groups most similar to Paiute are Immigrants from Trinidad and Tobago (90.9%, a difference of 0.040%), Immigrants from Peru (91.0%, a difference of 0.050%), West Indian (91.0%, a difference of 0.050%), Immigrants from South Eastern Asia (90.9%, a difference of 0.050%), and Trinidadian and Tobagonian (91.1%, a difference of 0.080%).
| Demographics | Rating | Rank | 11th Grade |
| Immigrants | Western Africa | 0.3 /100 | #266 | Tragic 91.2% |
| Immigrants | Jamaica | 0.3 /100 | #267 | Tragic 91.2% |
| U.S. Virgin Islanders | 0.2 /100 | #268 | Tragic 91.1% |
| Ute | 0.2 /100 | #269 | Tragic 91.1% |
| Trinidadians and Tobagonians | 0.2 /100 | #270 | Tragic 91.1% |
| Immigrants | Peru | 0.1 /100 | #271 | Tragic 91.0% |
| West Indians | 0.1 /100 | #272 | Tragic 91.0% |
| Paiute | 0.1 /100 | #273 | Tragic 91.0% |
| Immigrants | Trinidad and Tobago | 0.1 /100 | #274 | Tragic 90.9% |
| Immigrants | South Eastern Asia | 0.1 /100 | #275 | Tragic 90.9% |
| Bangladeshis | 0.1 /100 | #276 | Tragic 90.9% |
| Immigrants | Congo | 0.1 /100 | #277 | Tragic 90.9% |
| Malaysians | 0.1 /100 | #278 | Tragic 90.8% |
| Barbadians | 0.0 /100 | #279 | Tragic 90.8% |
| Sri Lankans | 0.0 /100 | #280 | Tragic 90.7% |