Latvian vs Paiute 11th Grade
COMPARE
Latvian
Paiute
11th Grade
11th Grade Comparison
Latvians
Paiute
94.7%
11TH GRADE
100.0/ 100
METRIC RATING
12th/ 347
METRIC RANK
91.0%
11TH GRADE
0.1/ 100
METRIC RATING
273rd/ 347
METRIC RANK
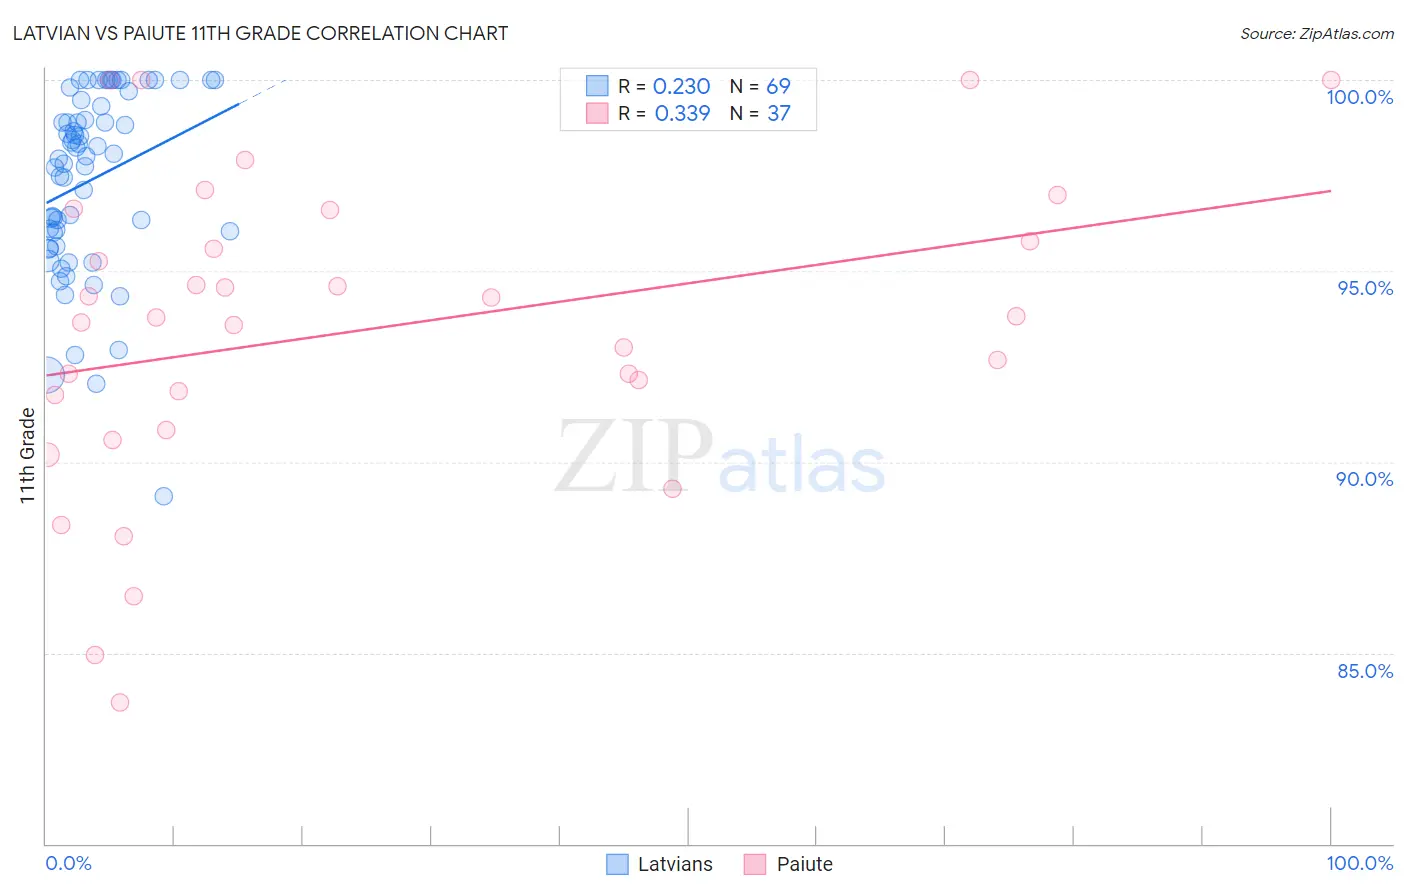
Latvian vs Paiute 11th Grade Correlation Chart
The statistical analysis conducted on geographies consisting of 220,726,252 people shows a weak positive correlation between the proportion of Latvians and percentage of population with at least 11th grade education in the United States with a correlation coefficient (R) of 0.230 and weighted average of 94.7%. Similarly, the statistical analysis conducted on geographies consisting of 58,403,520 people shows a mild positive correlation between the proportion of Paiute and percentage of population with at least 11th grade education in the United States with a correlation coefficient (R) of 0.339 and weighted average of 91.0%, a difference of 4.0%.
11th Grade Correlation Summary
| Measurement | Latvian | Paiute |
| Minimum | 89.1% | 83.7% |
| Maximum | 100.0% | 100.0% |
| Range | 10.9% | 16.3% |
| Mean | 97.4% | 93.4% |
| Median | 98.0% | 93.8% |
| Interquartile 25% (IQ1) | 95.8% | 91.3% |
| Interquartile 75% (IQ3) | 99.4% | 96.2% |
| Interquartile Range (IQR) | 3.6% | 4.9% |
| Standard Deviation (Sample) | 2.4% | 4.0% |
| Standard Deviation (Population) | 2.4% | 4.0% |
Similar Demographics by 11th Grade
Demographics Similar to Latvians by 11th Grade
In terms of 11th grade, the demographic groups most similar to Latvians are Finnish (94.7%, a difference of 0.0%), German (94.7%, a difference of 0.0%), Chinese (94.6%, a difference of 0.030%), Danish (94.7%, a difference of 0.050%), and Croatian (94.7%, a difference of 0.090%).
| Demographics | Rating | Rank | 11th Grade |
| Carpatho Rusyns | 100.0 /100 | #5 | Exceptional 94.8% |
| Lithuanians | 100.0 /100 | #6 | Exceptional 94.8% |
| Poles | 100.0 /100 | #7 | Exceptional 94.8% |
| Croatians | 100.0 /100 | #8 | Exceptional 94.7% |
| Danes | 100.0 /100 | #9 | Exceptional 94.7% |
| Finns | 100.0 /100 | #10 | Exceptional 94.7% |
| Germans | 100.0 /100 | #11 | Exceptional 94.7% |
| Latvians | 100.0 /100 | #12 | Exceptional 94.7% |
| Chinese | 100.0 /100 | #13 | Exceptional 94.6% |
| Eastern Europeans | 100.0 /100 | #14 | Exceptional 94.6% |
| Bulgarians | 100.0 /100 | #15 | Exceptional 94.5% |
| Immigrants | India | 100.0 /100 | #16 | Exceptional 94.5% |
| Luxembourgers | 100.0 /100 | #17 | Exceptional 94.5% |
| Maltese | 100.0 /100 | #18 | Exceptional 94.5% |
| Scandinavians | 100.0 /100 | #19 | Exceptional 94.5% |
Demographics Similar to Paiute by 11th Grade
In terms of 11th grade, the demographic groups most similar to Paiute are Immigrants from Trinidad and Tobago (90.9%, a difference of 0.040%), Immigrants from Peru (91.0%, a difference of 0.050%), West Indian (91.0%, a difference of 0.050%), Immigrants from South Eastern Asia (90.9%, a difference of 0.050%), and Trinidadian and Tobagonian (91.1%, a difference of 0.080%).
| Demographics | Rating | Rank | 11th Grade |
| Immigrants | Western Africa | 0.3 /100 | #266 | Tragic 91.2% |
| Immigrants | Jamaica | 0.3 /100 | #267 | Tragic 91.2% |
| U.S. Virgin Islanders | 0.2 /100 | #268 | Tragic 91.1% |
| Ute | 0.2 /100 | #269 | Tragic 91.1% |
| Trinidadians and Tobagonians | 0.2 /100 | #270 | Tragic 91.1% |
| Immigrants | Peru | 0.1 /100 | #271 | Tragic 91.0% |
| West Indians | 0.1 /100 | #272 | Tragic 91.0% |
| Paiute | 0.1 /100 | #273 | Tragic 91.0% |
| Immigrants | Trinidad and Tobago | 0.1 /100 | #274 | Tragic 90.9% |
| Immigrants | South Eastern Asia | 0.1 /100 | #275 | Tragic 90.9% |
| Bangladeshis | 0.1 /100 | #276 | Tragic 90.9% |
| Immigrants | Congo | 0.1 /100 | #277 | Tragic 90.9% |
| Malaysians | 0.1 /100 | #278 | Tragic 90.8% |
| Barbadians | 0.0 /100 | #279 | Tragic 90.8% |
| Sri Lankans | 0.0 /100 | #280 | Tragic 90.7% |