Immigrants vs Immigrants from Somalia 11th Grade
COMPARE
Immigrants
Immigrants from Somalia
11th Grade
11th Grade Comparison
Immigrants
Immigrants from Somalia
89.7%
11TH GRADE
0.0/ 100
METRIC RATING
303rd/ 347
METRIC RANK
91.9%
11TH GRADE
5.2/ 100
METRIC RATING
226th/ 347
METRIC RANK
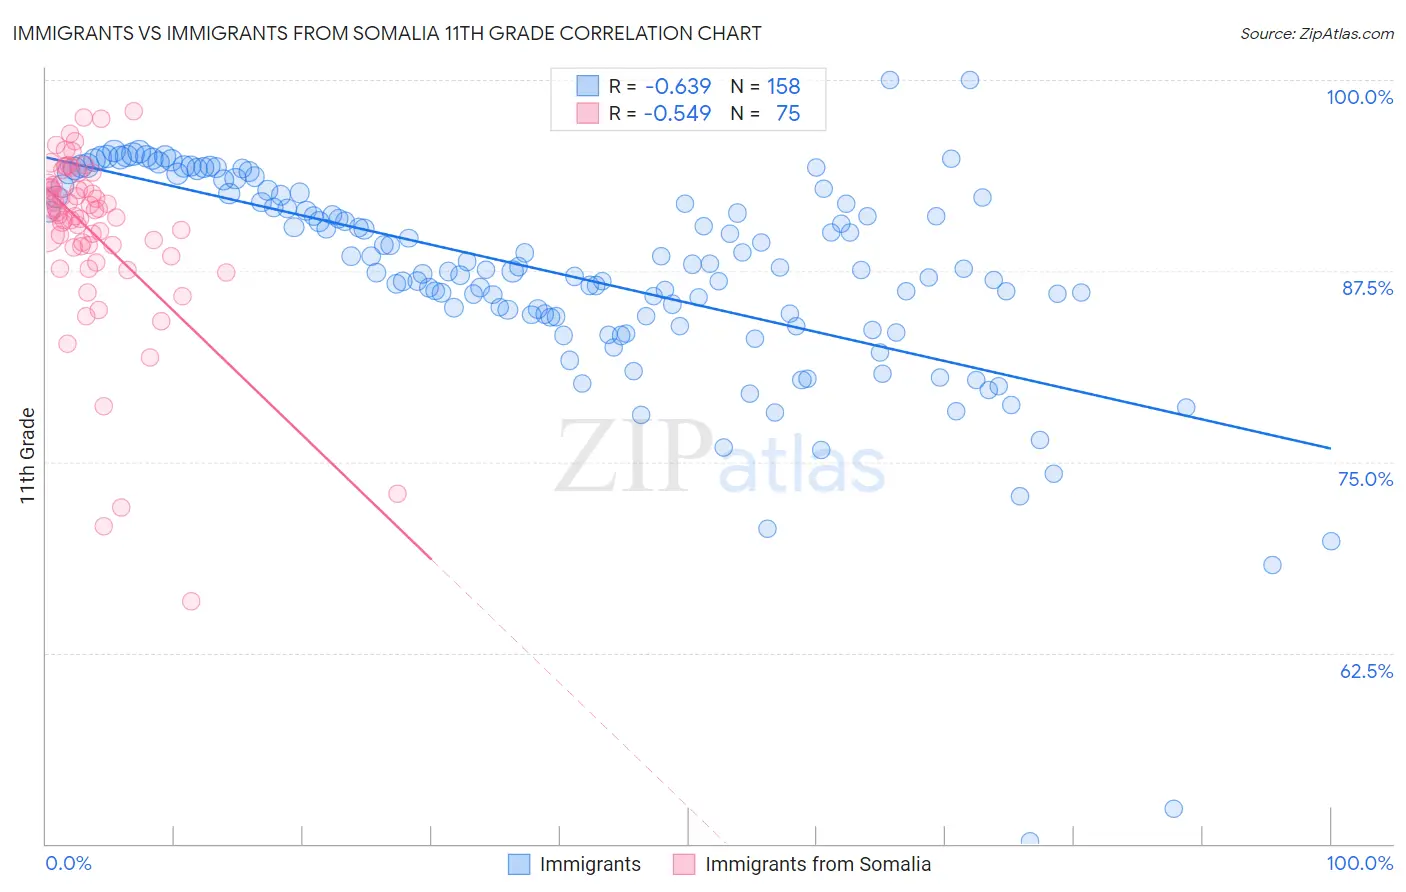
Immigrants vs Immigrants from Somalia 11th Grade Correlation Chart
The statistical analysis conducted on geographies consisting of 577,785,939 people shows a significant negative correlation between the proportion of Immigrants and percentage of population with at least 11th grade education in the United States with a correlation coefficient (R) of -0.639 and weighted average of 89.7%. Similarly, the statistical analysis conducted on geographies consisting of 92,101,093 people shows a substantial negative correlation between the proportion of Immigrants from Somalia and percentage of population with at least 11th grade education in the United States with a correlation coefficient (R) of -0.549 and weighted average of 91.9%, a difference of 2.4%.
11th Grade Correlation Summary
| Measurement | Immigrants | Immigrants from Somalia |
| Minimum | 50.2% | 65.9% |
| Maximum | 100.0% | 97.9% |
| Range | 49.8% | 32.0% |
| Mean | 87.3% | 90.0% |
| Median | 87.7% | 91.3% |
| Interquartile 25% (IQ1) | 84.6% | 89.0% |
| Interquartile 75% (IQ3) | 92.3% | 93.1% |
| Interquartile Range (IQR) | 7.8% | 4.1% |
| Standard Deviation (Sample) | 7.1% | 5.9% |
| Standard Deviation (Population) | 7.1% | 5.9% |
Similar Demographics by 11th Grade
Demographics Similar to Immigrants by 11th Grade
In terms of 11th grade, the demographic groups most similar to Immigrants are Yuman (89.7%, a difference of 0.0%), Immigrants from Guyana (89.7%, a difference of 0.010%), Immigrants from Cambodia (89.6%, a difference of 0.080%), Ecuadorian (89.6%, a difference of 0.13%), and Immigrants from Dominica (89.5%, a difference of 0.19%).
| Demographics | Rating | Rank | 11th Grade |
| Fijians | 0.0 /100 | #296 | Tragic 90.0% |
| Navajo | 0.0 /100 | #297 | Tragic 90.0% |
| Immigrants | Fiji | 0.0 /100 | #298 | Tragic 89.9% |
| Japanese | 0.0 /100 | #299 | Tragic 89.9% |
| Immigrants | Haiti | 0.0 /100 | #300 | Tragic 89.9% |
| Guyanese | 0.0 /100 | #301 | Tragic 89.9% |
| Immigrants | Guyana | 0.0 /100 | #302 | Tragic 89.7% |
| Immigrants | Immigrants | 0.0 /100 | #303 | Tragic 89.7% |
| Yuman | 0.0 /100 | #304 | Tragic 89.7% |
| Immigrants | Cambodia | 0.0 /100 | #305 | Tragic 89.6% |
| Ecuadorians | 0.0 /100 | #306 | Tragic 89.6% |
| Immigrants | Dominica | 0.0 /100 | #307 | Tragic 89.5% |
| Nepalese | 0.0 /100 | #308 | Tragic 89.5% |
| Immigrants | Bangladesh | 0.0 /100 | #309 | Tragic 89.5% |
| Yaqui | 0.0 /100 | #310 | Tragic 89.5% |
Demographics Similar to Immigrants from Somalia by 11th Grade
In terms of 11th grade, the demographic groups most similar to Immigrants from Somalia are Immigrants from Zaire (91.9%, a difference of 0.010%), Costa Rican (91.9%, a difference of 0.050%), Immigrants from Cameroon (91.8%, a difference of 0.050%), Immigrants from Panama (91.8%, a difference of 0.050%), and Nigerian (91.8%, a difference of 0.050%).
| Demographics | Rating | Rank | 11th Grade |
| Portuguese | 10.0 /100 | #219 | Tragic 92.0% |
| South American Indians | 7.6 /100 | #220 | Tragic 92.0% |
| Immigrants | Liberia | 7.0 /100 | #221 | Tragic 91.9% |
| Immigrants | Africa | 6.5 /100 | #222 | Tragic 91.9% |
| Immigrants | Bahamas | 6.5 /100 | #223 | Tragic 91.9% |
| Costa Ricans | 6.3 /100 | #224 | Tragic 91.9% |
| Immigrants | Zaire | 5.4 /100 | #225 | Tragic 91.9% |
| Immigrants | Somalia | 5.2 /100 | #226 | Tragic 91.9% |
| Immigrants | Cameroon | 4.4 /100 | #227 | Tragic 91.8% |
| Immigrants | Panama | 4.3 /100 | #228 | Tragic 91.8% |
| Nigerians | 4.3 /100 | #229 | Tragic 91.8% |
| Immigrants | Afghanistan | 3.9 /100 | #230 | Tragic 91.8% |
| Choctaw | 3.7 /100 | #231 | Tragic 91.8% |
| Uruguayans | 3.5 /100 | #232 | Tragic 91.8% |
| Cheyenne | 3.3 /100 | #233 | Tragic 91.8% |