Creek vs Immigrants from Western Asia 10th Grade
COMPARE
Creek
Immigrants from Western Asia
10th Grade
10th Grade Comparison
Creek
Immigrants from Western Asia
94.2%
10TH GRADE
91.9/ 100
METRIC RATING
133rd/ 347
METRIC RANK
93.4%
10TH GRADE
20.6/ 100
METRIC RATING
203rd/ 347
METRIC RANK
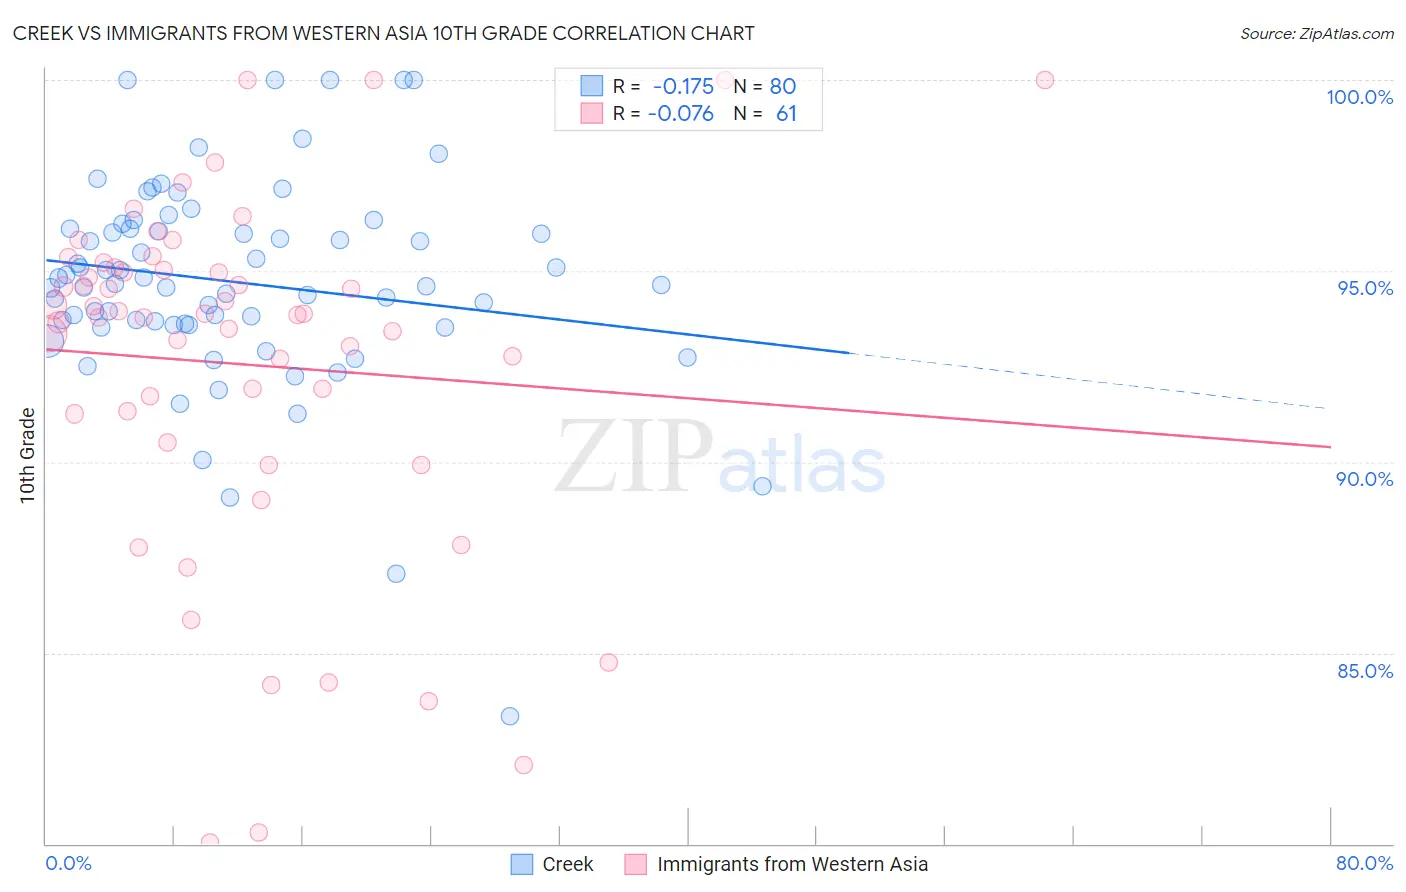
Creek vs Immigrants from Western Asia 10th Grade Correlation Chart
The statistical analysis conducted on geographies consisting of 178,480,629 people shows a poor negative correlation between the proportion of Creek and percentage of population with at least 10th grade education in the United States with a correlation coefficient (R) of -0.175 and weighted average of 94.2%. Similarly, the statistical analysis conducted on geographies consisting of 404,433,811 people shows a slight negative correlation between the proportion of Immigrants from Western Asia and percentage of population with at least 10th grade education in the United States with a correlation coefficient (R) of -0.076 and weighted average of 93.4%, a difference of 0.85%.
10th Grade Correlation Summary
| Measurement | Creek | Immigrants from Western Asia |
| Minimum | 83.3% | 80.0% |
| Maximum | 100.0% | 100.0% |
| Range | 16.7% | 20.0% |
| Mean | 94.7% | 92.6% |
| Median | 94.6% | 93.8% |
| Interquartile 25% (IQ1) | 93.6% | 90.9% |
| Interquartile 75% (IQ3) | 96.1% | 95.1% |
| Interquartile Range (IQR) | 2.5% | 4.2% |
| Standard Deviation (Sample) | 2.7% | 4.6% |
| Standard Deviation (Population) | 2.7% | 4.6% |
Similar Demographics by 10th Grade
Demographics Similar to Creek by 10th Grade
In terms of 10th grade, the demographic groups most similar to Creek are Immigrants from Russia (94.3%, a difference of 0.010%), Osage (94.2%, a difference of 0.010%), Immigrants from Eastern Europe (94.3%, a difference of 0.020%), Immigrants from Korea (94.2%, a difference of 0.020%), and Iroquois (94.3%, a difference of 0.030%).
| Demographics | Rating | Rank | 10th Grade |
| Immigrants | Iran | 94.4 /100 | #126 | Exceptional 94.3% |
| Israelis | 93.8 /100 | #127 | Exceptional 94.3% |
| Potawatomi | 93.6 /100 | #128 | Exceptional 94.3% |
| Iroquois | 92.8 /100 | #129 | Exceptional 94.3% |
| Immigrants | Greece | 92.7 /100 | #130 | Exceptional 94.3% |
| Immigrants | Eastern Europe | 92.5 /100 | #131 | Exceptional 94.3% |
| Immigrants | Russia | 92.4 /100 | #132 | Exceptional 94.3% |
| Creek | 91.9 /100 | #133 | Exceptional 94.2% |
| Osage | 91.7 /100 | #134 | Exceptional 94.2% |
| Immigrants | Korea | 91.3 /100 | #135 | Exceptional 94.2% |
| Shoshone | 90.8 /100 | #136 | Exceptional 94.2% |
| Arapaho | 90.5 /100 | #137 | Exceptional 94.2% |
| Immigrants | Sri Lanka | 89.9 /100 | #138 | Excellent 94.2% |
| Immigrants | Bosnia and Herzegovina | 89.4 /100 | #139 | Excellent 94.2% |
| Immigrants | Jordan | 87.6 /100 | #140 | Excellent 94.1% |
Demographics Similar to Immigrants from Western Asia by 10th Grade
In terms of 10th grade, the demographic groups most similar to Immigrants from Western Asia are Ute (93.4%, a difference of 0.0%), Immigrants from Indonesia (93.4%, a difference of 0.0%), Immigrants from Uganda (93.5%, a difference of 0.010%), Immigrants from Sudan (93.4%, a difference of 0.010%), and Samoan (93.4%, a difference of 0.010%).
| Demographics | Rating | Rank | 10th Grade |
| Moroccans | 25.3 /100 | #196 | Fair 93.5% |
| Pueblo | 23.9 /100 | #197 | Fair 93.5% |
| Immigrants | Micronesia | 23.2 /100 | #198 | Fair 93.5% |
| Asians | 23.0 /100 | #199 | Fair 93.5% |
| Hopi | 22.2 /100 | #200 | Fair 93.5% |
| Hawaiians | 21.8 /100 | #201 | Fair 93.5% |
| Immigrants | Uganda | 20.9 /100 | #202 | Fair 93.5% |
| Immigrants | Western Asia | 20.6 /100 | #203 | Fair 93.4% |
| Ute | 20.3 /100 | #204 | Fair 93.4% |
| Immigrants | Indonesia | 20.2 /100 | #205 | Fair 93.4% |
| Immigrants | Sudan | 20.0 /100 | #206 | Fair 93.4% |
| Samoans | 19.5 /100 | #207 | Poor 93.4% |
| Immigrants | Syria | 19.4 /100 | #208 | Poor 93.4% |
| Immigrants | Chile | 18.8 /100 | #209 | Poor 93.4% |
| Indians (Asian) | 17.6 /100 | #210 | Poor 93.4% |