Immigrants from Zaire vs Eastern European No Schooling Completed
COMPARE
Immigrants from Zaire
Eastern European
No Schooling Completed
No Schooling Completed Comparison
Immigrants from Zaire
Eastern Europeans
2.3%
NO SCHOOLING COMPLETED
7.2/ 100
METRIC RATING
215th/ 347
METRIC RANK
1.6%
NO SCHOOLING COMPLETED
100.0/ 100
METRIC RATING
35th/ 347
METRIC RANK
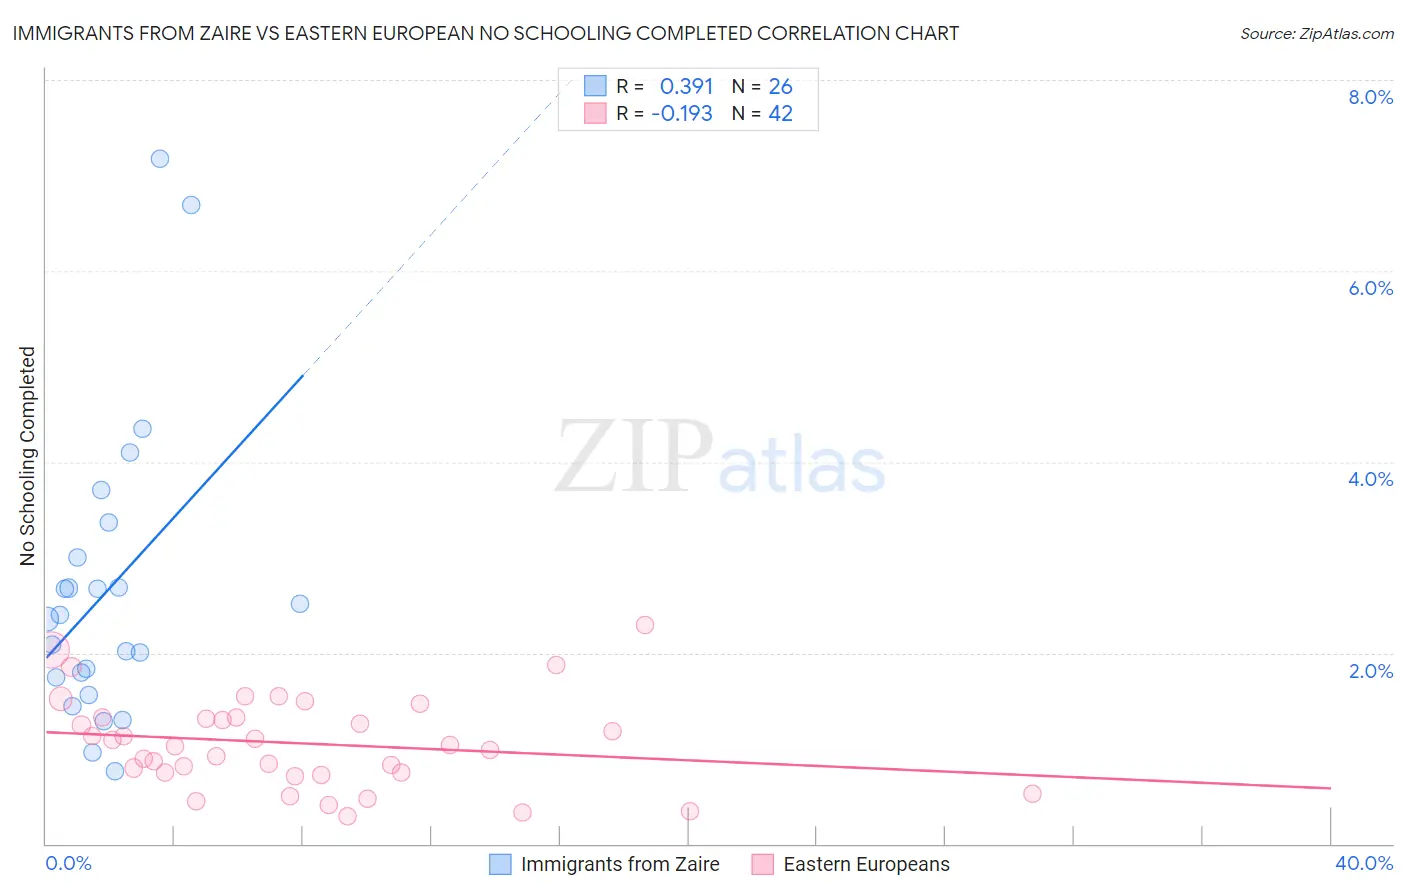
Immigrants from Zaire vs Eastern European No Schooling Completed Correlation Chart
The statistical analysis conducted on geographies consisting of 107,090,561 people shows a mild positive correlation between the proportion of Immigrants from Zaire and percentage of population with no schooling in the United States with a correlation coefficient (R) of 0.391 and weighted average of 2.3%. Similarly, the statistical analysis conducted on geographies consisting of 452,907,345 people shows a poor negative correlation between the proportion of Eastern Europeans and percentage of population with no schooling in the United States with a correlation coefficient (R) of -0.193 and weighted average of 1.6%, a difference of 45.9%.
No Schooling Completed Correlation Summary
| Measurement | Immigrants from Zaire | Eastern European |
| Minimum | 0.76% | 0.29% |
| Maximum | 7.2% | 2.3% |
| Range | 6.4% | 2.0% |
| Mean | 2.7% | 1.1% |
| Median | 2.4% | 1.0% |
| Interquartile 25% (IQ1) | 1.7% | 0.74% |
| Interquartile 75% (IQ3) | 3.0% | 1.3% |
| Interquartile Range (IQR) | 1.3% | 0.57% |
| Standard Deviation (Sample) | 1.5% | 0.48% |
| Standard Deviation (Population) | 1.5% | 0.47% |
Similar Demographics by No Schooling Completed
Demographics Similar to Immigrants from Zaire by No Schooling Completed
In terms of no schooling completed, the demographic groups most similar to Immigrants from Zaire are Tongan (2.3%, a difference of 0.20%), Immigrants from Syria (2.3%, a difference of 0.28%), Immigrants from Nepal (2.3%, a difference of 0.39%), Samoan (2.3%, a difference of 0.43%), and Ute (2.3%, a difference of 0.47%).
| Demographics | Rating | Rank | No Schooling Completed |
| Uruguayans | 11.0 /100 | #208 | Poor 2.2% |
| Immigrants | Oceania | 10.2 /100 | #209 | Poor 2.2% |
| Natives/Alaskans | 10.0 /100 | #210 | Tragic 2.2% |
| Immigrants | Panama | 8.8 /100 | #211 | Tragic 2.3% |
| Immigrants | Morocco | 8.7 /100 | #212 | Tragic 2.3% |
| Ute | 8.2 /100 | #213 | Tragic 2.3% |
| Samoans | 8.2 /100 | #214 | Tragic 2.3% |
| Immigrants | Zaire | 7.2 /100 | #215 | Tragic 2.3% |
| Tongans | 6.8 /100 | #216 | Tragic 2.3% |
| Immigrants | Syria | 6.6 /100 | #217 | Tragic 2.3% |
| Immigrants | Nepal | 6.4 /100 | #218 | Tragic 2.3% |
| Senegalese | 5.6 /100 | #219 | Tragic 2.3% |
| Immigrants | Costa Rica | 5.1 /100 | #220 | Tragic 2.3% |
| Immigrants | Sudan | 5.0 /100 | #221 | Tragic 2.3% |
| Sub-Saharan Africans | 4.7 /100 | #222 | Tragic 2.3% |
Demographics Similar to Eastern Europeans by No Schooling Completed
In terms of no schooling completed, the demographic groups most similar to Eastern Europeans are Latvian (1.5%, a difference of 0.95%), Aleut (1.6%, a difference of 1.0%), Italian (1.5%, a difference of 1.2%), Belgian (1.6%, a difference of 1.3%), and Northern European (1.6%, a difference of 1.4%).
| Demographics | Rating | Rank | No Schooling Completed |
| French Canadians | 100.0 /100 | #28 | Exceptional 1.5% |
| Lumbee | 100.0 /100 | #29 | Exceptional 1.5% |
| British | 100.0 /100 | #30 | Exceptional 1.5% |
| Inupiat | 100.0 /100 | #31 | Exceptional 1.5% |
| Swiss | 100.0 /100 | #32 | Exceptional 1.5% |
| Italians | 100.0 /100 | #33 | Exceptional 1.5% |
| Latvians | 100.0 /100 | #34 | Exceptional 1.5% |
| Eastern Europeans | 100.0 /100 | #35 | Exceptional 1.6% |
| Aleuts | 99.9 /100 | #36 | Exceptional 1.6% |
| Belgians | 99.9 /100 | #37 | Exceptional 1.6% |
| Northern Europeans | 99.9 /100 | #38 | Exceptional 1.6% |
| Native Hawaiians | 99.9 /100 | #39 | Exceptional 1.6% |
| Luxembourgers | 99.9 /100 | #40 | Exceptional 1.6% |
| Hungarians | 99.9 /100 | #41 | Exceptional 1.6% |
| Bulgarians | 99.9 /100 | #42 | Exceptional 1.6% |